Publication date: 07/30/2020
Example of a 3D Scatterplot
This example uses the Iris.jmp sample data table, which includes measurements of sepal length, sepal width, petal length, and petal width for three species of iris.
1. Open the Iris.jmp sample data table.
2. Select Graph > Scatterplot 3D.
3. Select Sepal length, Sepal width, and Petal length, and click Y, Columns.
4. Select Petal width and click Weight.
5. Click OK.
Figure 9.2 Example of an Initial 3D Scatterplot
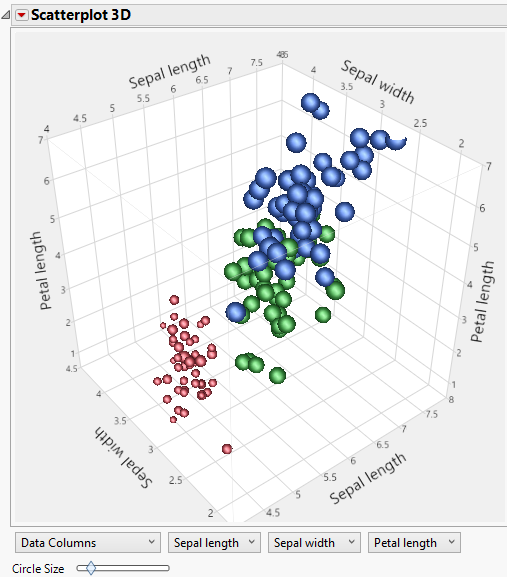
Now you can spin the 3D scatterplot to see the relationships between the variables. In this example, the data points are formatted in blue, red, and green. You might want to spin the scatterplot to see more clearly the relationships between the red and green points.
Want more information? Have questions? Get answers in the JMP User Community (community.jmp.com).