Publication date: 07/30/2020
Example of a Contour Plot in Graph Builder
You can create the same contour plot shown in Figure 10.2 using Graph Builder.
1. Select Help > Sample Data Library and open Little Pond.jmp.
2. Select Graph > Graph Builder.
3. Click and drag the X coordinate to the X zone.
4. Click and drag the Y coordinate to the Y zone.
5. Click and drag depth, Z, to the Color zone.
6. Click the Contour ![]() icon.
icon.
Figure 10.3 Contour Plot in Graph Builder
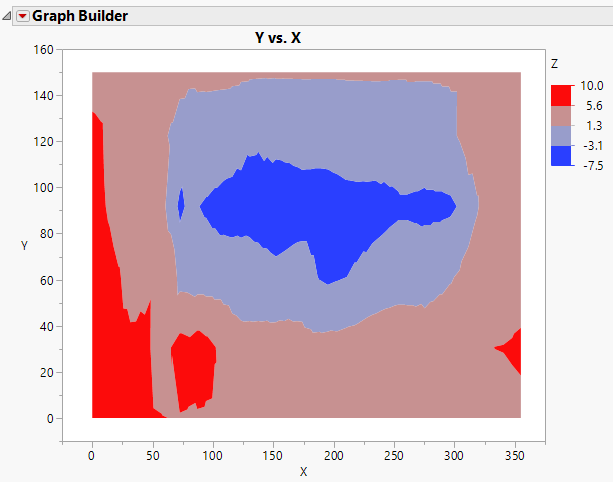
Notice the plot produced from the Contour platform looks slightly different than the plot produced using Graph Builder.
Want more information? Have questions? Get answers in the JMP User Community (community.jmp.com).