Publication date: 07/30/2020
Example of a Normal Quantile Plot
1. Select Help > Sample Data Library and open Big Class.jmp.
2. Select Analyze > Fit Y by X.
3. Select height and click Y, Response.
4. Select sex and click X, Factor.
5. Click OK.
6. Click the red triangle next to Oneway Analysis of height By sex and select Normal Quantile Plot > Plot Actual by Quantile.
Figure 6.34 Example of a Normal Quantile Plot
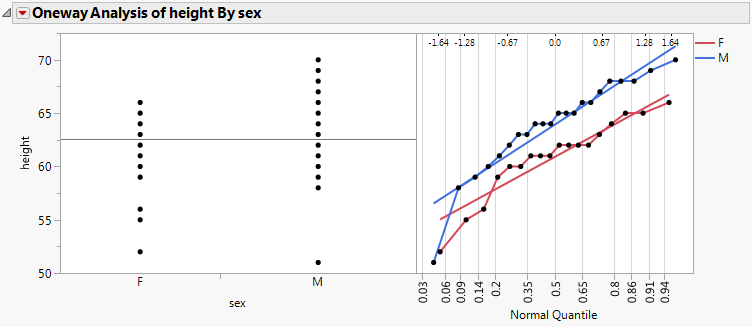
Note the following:
• The Line of Fit appears by default.
• The data points track very closely to the line of fit, indicating a normal distribution.
Want more information? Have questions? Get answers in the JMP User Community (community.jmp.com).