Publication date: 07/30/2020
Example of an Analysis of Means Chart
1. Select Help > Sample Data Library and open Analgesics.jmp.
2. Select Analyze > Fit Y by X.
3. Select pain and click Y, Response.
4. Select drug and click X, Factor.
5. Click OK.
6. Click the Analysis of Means red triangle and select Analysis of Means Methods > ANOM.
Figure 6.13 Example of Analysis of Means Chart
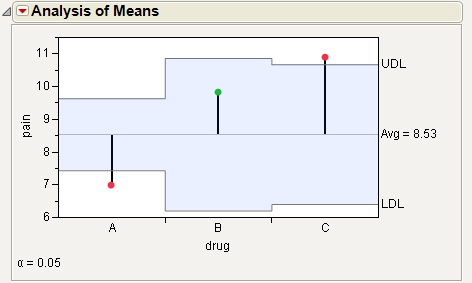
For the example, the means for drug A and C are statistically different from the overall mean. The drug A mean is lower and the drug C mean is higher. Note the decision limits for the drug types are not the same, due to different sample sizes.
Want more information? Have questions? Get answers in the JMP User Community (community.jmp.com).