Publication date: 07/30/2020
Example of an MDMVCC with a PLS Model
This example demonstrates the use of a PLS model for monitoring a multivariate process.
1. Select Help > Sample Data Library and open Baltic.jmp.
2. Run the Partial Least Squares table script.
3. Click the NIPALS Fit with 7 Factors red triangle and select Save Columns > Save Score Formula.
4. Select Analyze > Quality and Process > Model Driven Multivariate Control Chart.
5. Select the X Score 1 Formula through X Score 7 Formula and click Process.
6. Click OK.
7. Hover over the first sample data point and click on the contribution proportion plot to open a larger version of the plot.
Figure 11.9 T2 Chart and Sample 1 Contribution Proportion Plot
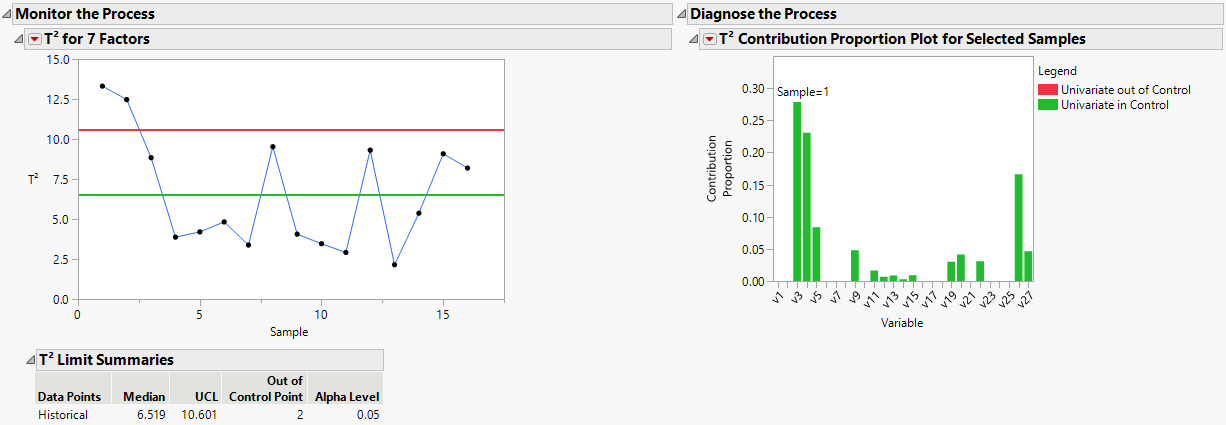
Notice that the contributions plot is in terms of the PLS model input variables.
Want more information? Have questions? Get answers in the JMP User Community (community.jmp.com).