 Example of Boosted Tree with a Categorical Response
In this example, you construct a boosted tree model to predict which printing jobs are affected by a defect called banding.
1. Select Help > Sample Data and open Bands Data.jmp.
2. Select Analyze > Predictive Modeling > Boosted Tree.
3. Select Banding? and click Y, Response.
4. Select the Predictors column group and click X, Factor.
5. Enter 0.2 for Validation Portion.
6. Click OK.
The Boosted Tree Specification window appears.
7. (Optional) In the Reproducibility panel, select Suppress Multithreading and enter 123 for Random Seed.
Because the boosted tree fit involves a random component, these actions ensure that you obtain the exact results shown below.
8. Click OK.
Figure 6.2 Overall Statistics for Nominal Response
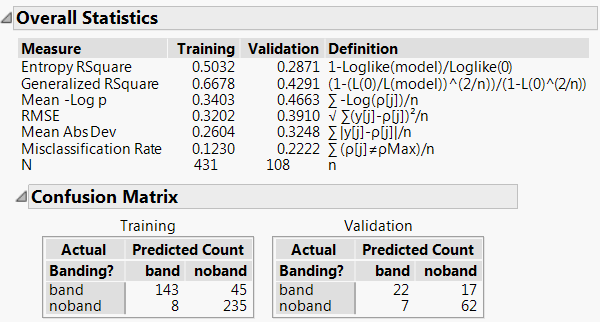
Because the response, Banding?, is categorical, the Boosted Tree analysis provides a Misclassification Rate under Measure and a Confusion Matrix report. The Misclassification Rate for the validation set is 0.2222, or about 22%.
9. Click the red triangle next to Boosted Tree for Banding? and select Show Trees > Show names categories estimates.
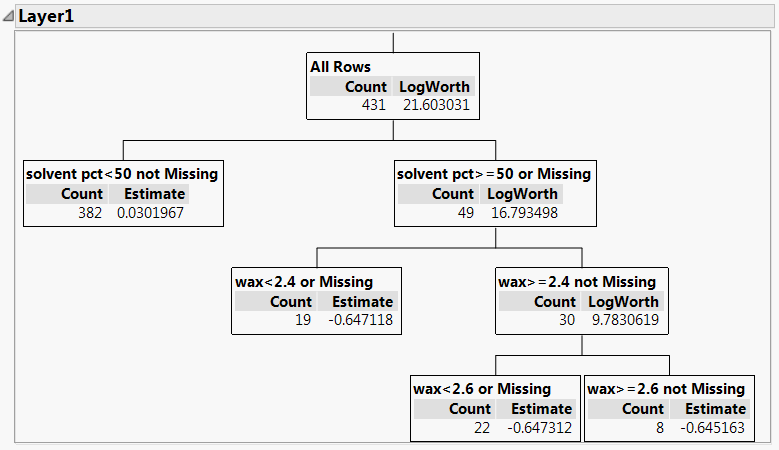
A Tree Views report appears, with outlines for the layers. You can examine the layers to see the trees that are fit and the predicted values.
Figure 6.3 Layer 1 of the Boosted Tree
10. Click the red triangle next to Boosted Tree for Banding? and select Save Columns > Save Prediction Formula.
Columns called Prob(Banding?==noband), Prob(Banding?==band), and Most Likely Banding? are added to the data table. Examine the Prob(Banding?==noband) column to see how model predictions are calculated from the layers.