Example of Measurement Systems Analysis
In this example, three operators measured the same five parts. See how the measurement system is performing, based on how much variation is found in the measurements.
1. Select Help > Sample Data Library and open Variability Data/Gasket.jmp.
2. Select Analyze > Quality and Process > Measurement Systems Analysis.
3. Assign Y to the Y, Response role.
4. Assign Part to the Part, Sample ID role.
5. Assign Operator to the X, Grouping role.
Notice that the MSA Method is set to EMP, the Chart Dispersion Type is set to Range, and the Model Type is set to Crossed.
6. Click OK.
Figure 4.2 MSA Initial Report
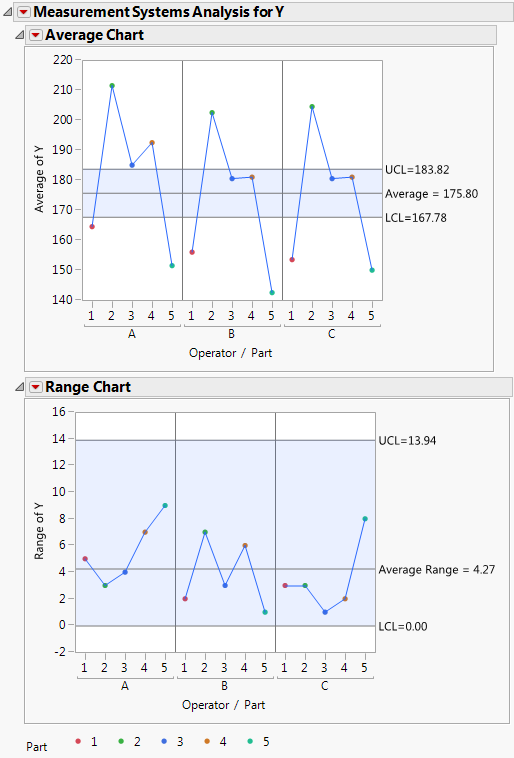
The Average Chart shows the average measurements for each operator and part combination. In this example, the means of the part measurements are generally beyond the control limits. This is a desirable outcome, because it indicates that you can detect part-to-part variation.
The Range Chart shows the variability for each operator and part combination. In this example, the ranges are within the control limits. This is a desirable outcome, because it indicates that the operators are measuring parts in the same way and with similar variation.
The color coding for each part is shown in the legend below the charts.
7. Click the red triangle next to Measurement Systems Analysis for Y and select Parallelism Plots.
Figure 4.3 Parallelism Plot for Operator and Part
The Parallelism Plots chart shows the average measurements for each part by operator. Because the lines are generally parallel and there is no major crossing, you conclude that there is no interaction between operators and parts.
Tip: Interactions indicate a serious issue that requires further investigation.
8. Click the red triangle next to Measurement Systems Analysis for Y and select EMP Results.
Figure 4.4 EMP Results Report
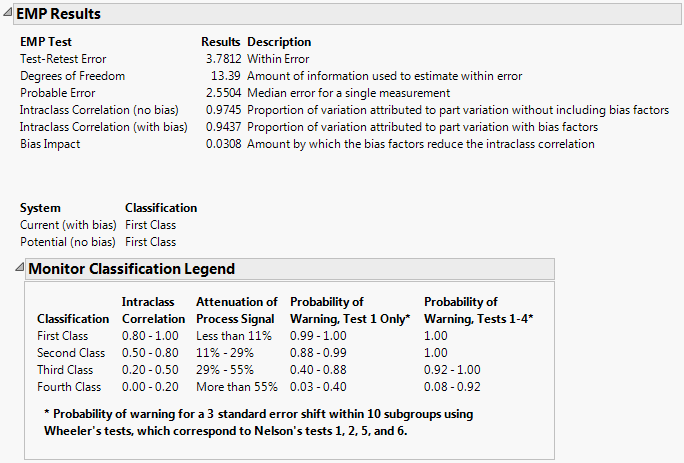
The EMP Results report computes several statistics to help you assess and classify your measurement system. The Intraclass Correlation indicates the proportion of the total variation that you can attribute to the part.
From the EMP Results report, you can conclude the following:
• The Intraclass Correlation values are close to 1, indicating that most of the variation is coming from the part instead of the measurement system.
• The classification is First Class, meaning that the strength of the process signal is weakened by less than 11%.
• There is at least a 99% chance of detecting a warning using Test 1 only.
• There is 100% chance of detecting a warning using Tests 1-4.
Note: For more information about tests and detecting process shifts, see Shift Detection Profiler.
There is no interaction between operators and parts, and there is very little variation in your measurements (the classification is First Class). Therefore, you conclude that the measurement system is performing quite well.