Example of Multiple Factor Analysis
This example uses data from a simulated sensory panel study of wine characteristics. Participants rated 16 wines on a number of characteristics from 1 (no intensity) to 10 (prominent intensity). You want to better understand how the 16 wines are similar or different.
1. Select Help > Sample Data Library and open Wine Sensory Data.jmp.
2. Select Analyze > Consumer Research > Multiple Factor Analysis.
3. Select Vineyard and click Product ID.
4. Select Region and click Z, Supplementary.
5. Select all of the column groups from Carolyn to Jose and click Add Block.
Note: The columns in this data table are grouped into one block for each panelist. For ungrouped data, select the columns for a block, click Add Block, and repeat for each block.
6. Click Run Model.
Figure 7.2 Initial Multiple Factor Analysis Report
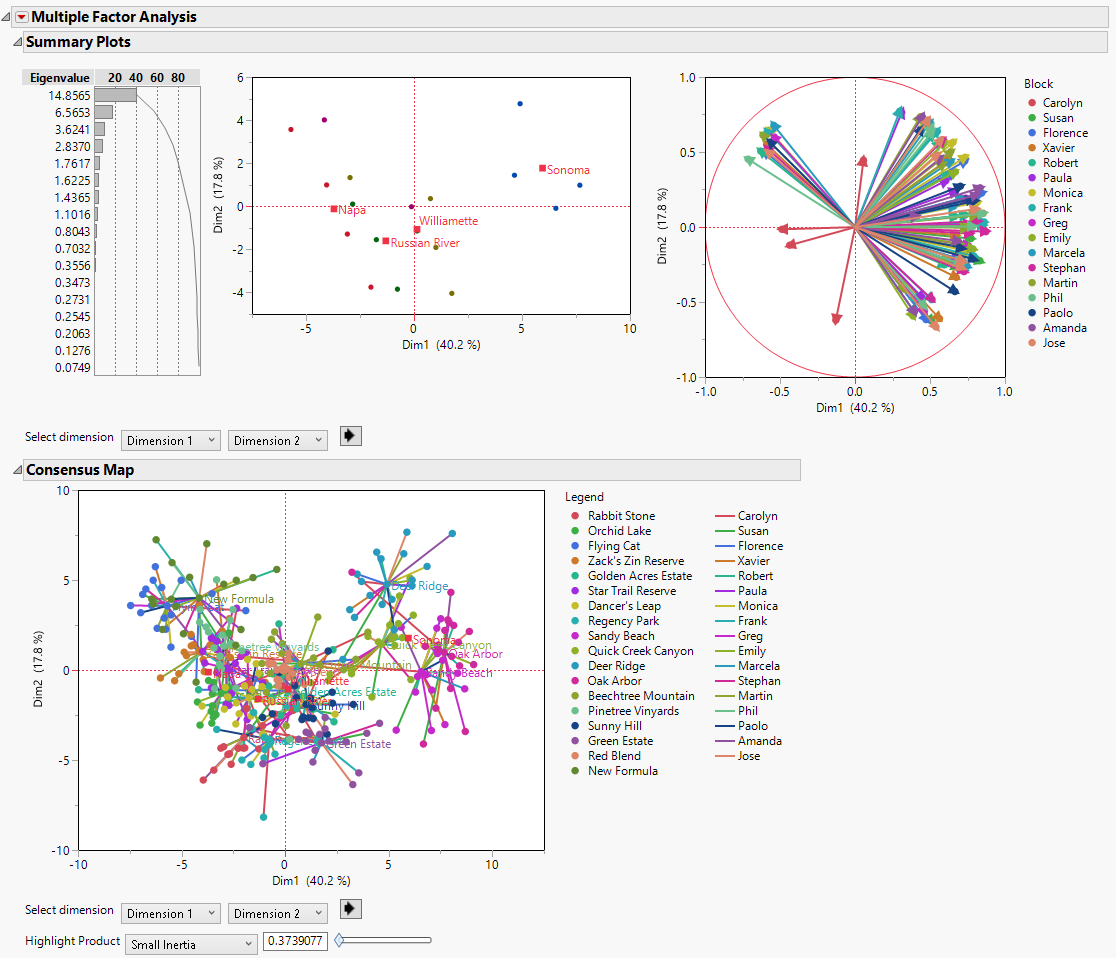
Tip: To set the legend in the Consensus Map to two columns, double-click the legend and set the Item Wrap in the Legend Settings to 18.
Notice the following in the Summary Plots:
– In the plot of the factor scores in the first two dimensions, the wines tend to cluster together according to their regions.
– In the loading plot, the rays in the lower left quadrant correspond to Carolyn. They indicate a difference between Carolyn and the other raters.
7. In the legend next to the loading plot, click Carolyn to highlight her results.
Figure 7.3 Loading Plot with Results for Carolyn Highlighted
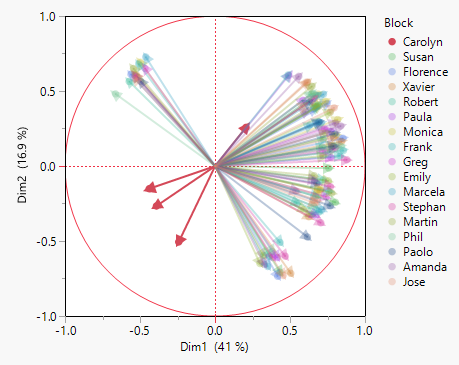
Carolyn’s results differ from the other panelists. You might want to re-run the analysis without her results. See Figure 7.6 for the results of the analysis without Carolyn.