Example of Ordinal Logistic Regression
This example uses the AdverseR.jmp sample data table to illustrate an ordinal logistic regression. Suppose you want to model the severity of an adverse event as a function of treatment duration value.
1. Select Help > Sample Data Library and open AdverseR.jmp.
2. Right-click the icon to the left of ADR SEVERITY and change the modeling type to ordinal.
3. Select Analyze > Fit Y by X.
4. Select ADR SEVERITY and click Y, Response.
5. Select ADR DURATION and click X, Factor.
6. Click OK.
Figure 8.5 Example of Ordinal Logistic Report
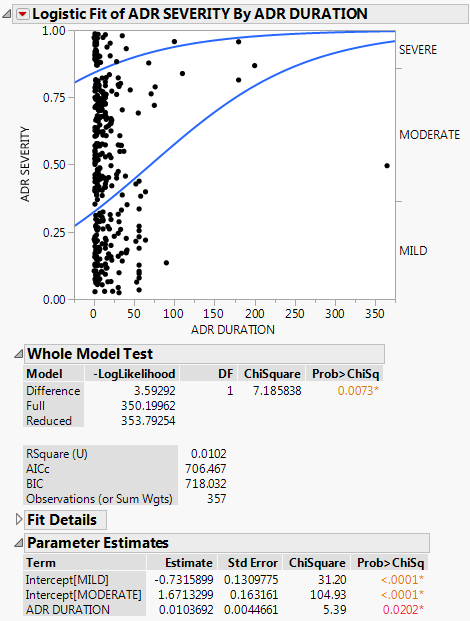
You interpret this report the same way as the nominal report. See The Logistic Report.
In the plot, markers for the data are drawn at their x-coordinate. When several data points appear at the same y position, the points are jittered. That is, small spaces appear between the data points so that you can see each point more clearly.
Where there are many points, the curves are pushed apart. Where there are few to no points, the curves are close together. The data pushes the curves in that way because the criterion that is maximized is the product of the probabilities fitted by the model. The fit tries to avoid points attributed to have a small probability, which are points crowded by the curves of fit. See Fitting Linear Models for more information about computational details.
For more information about the Whole Model Test report and the Parameter Estimates report, see The Logistic Report. In the Parameter Estimates report, an intercept parameter is estimated for every response level except the last, but there is only one slope parameter. The intercept parameters show the spacing of the response levels. They always increase monotonically.