Example of Process Capability
Suppose you want to characterize the acidity of pickles. The lower and upper specification limits are 8 and 17, respectively.
1. Select Help > Sample Data Library and open Quality Control/Pickles.jmp.
2. Select Analyze > Distribution.
3. Select Acid and click Y, Columns.
4. Click OK.
5. Click the Acid red triangle and select Process Capability.
6. Type 8 for the LSL (lower specification limit).
7. Type 17 for the USL (upper specification limit).
8. Click OK.
Figure 3.21 Example of the Process Capability Report
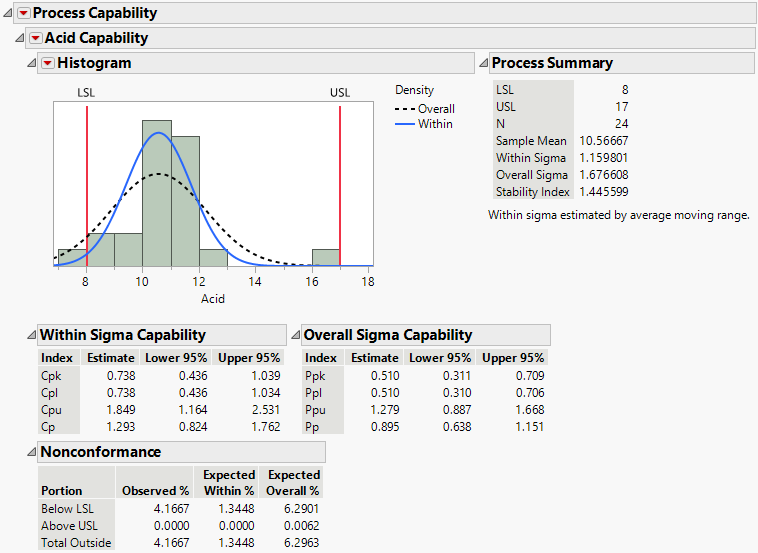
The Process Capability results are added to the report. The specification limits appear on the histogram in the Process Capability report so that the data can be visually compared to the limits. As you can see, some of the acidity levels are below the lower specification limit, and some are very close to the upper specification limit. The Ppk value is 0.510, indicating a process that is not capable, relative to the given specification limits.