Example of Process Screening
The Semiconductor Capability.jmp sample data table contains 128 columns of process measurements. Each column contains 1,455 measurements. You are interested in identifying unstable processes. Also, each column contains a Spec Limits column property. If a process is stable, it is appropriate to calculate its process capability. You proceed to assess both stability and capability for this data table.
1. Select Help > Sample Data Library and open Semiconductor Capability.jmp.
2. Select Analyze > Screening > Process Screening.
3. Select the Processes column group and click Process Variables.
Notice that the Control Chart Type is set to Indiv and MR.
4. Click OK.
Figure 22.2 Partial View of Initial Report
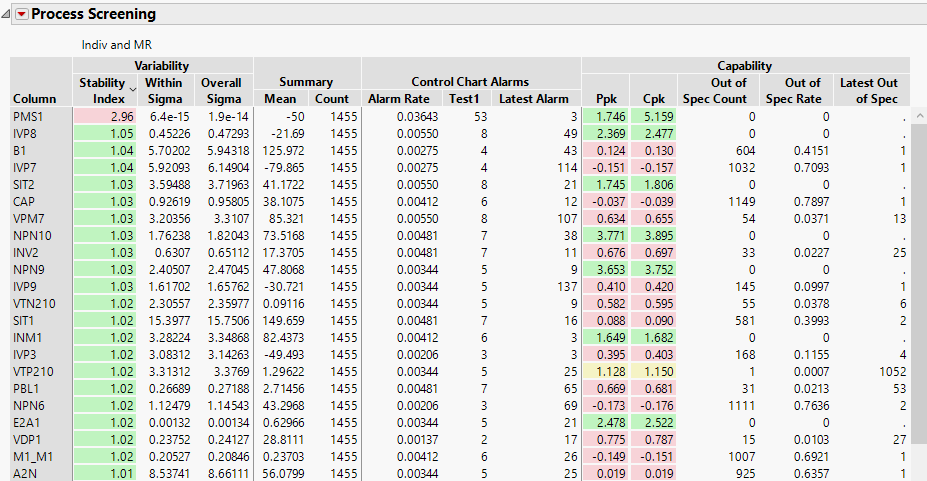
The Process Screening window appears, showing a table of results for each process. The table is sorted by Stability Index. This is a measure of the stability of a process, where a stable process has a stability index near 1. Higher values of the stability index indicate a less stable process. (The sorting is indicated by the caret beside Stability Index in the report.) You want to take a closer look at processes with a stability index value greater than or equal to 1.03.
5. In the report window, select processes PMS1 through IVP9.
Each of these first 11 processes has a value of 1.03 or larger in the Stability Index column.
6. Right-click the selected processes and select Quick Graph for Selected Items.
Figure 22.3 Quick Graphs for Highest Alarm Rate Processes
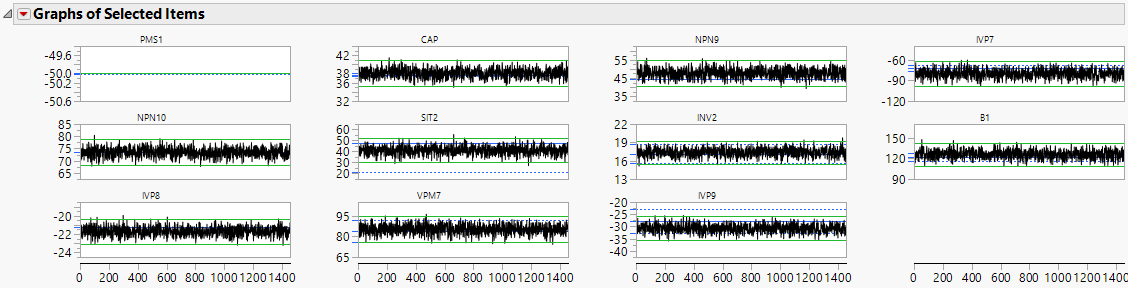
You decide to take a closer look at IVP8 (row 3, column 1 in the Graphs of Selected Items).
7. Select the second process in the Summary table, which corresponds to IVP8.
8. Right-click the selected process and select Control Charts for Selected Items.
Figure 22.4 Control Chart Builder Report for IVP8
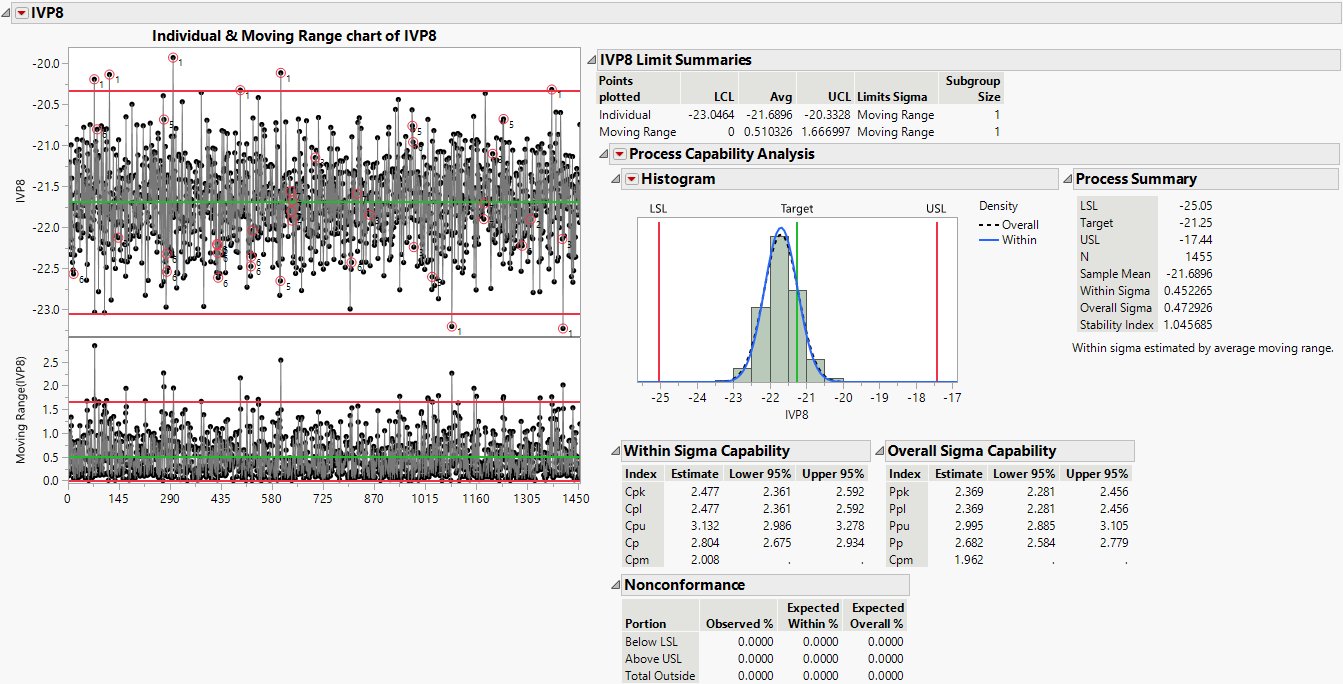
A Control Chart Builder report appears. Because IVP8 has a Spec Limits column property, the report also includes a capability analysis.