Example of Repeated Measures
This example uses the Presidential Elections.jmp sample data table, which contains United States presidential election results for each state from 1980 through 2012. Use this data table to explore repeated measures where we consider the election results as repeated measures.
1. Select Help > Sample Data Library and open Presidential Elections.jmp.
2. Select Analyze > Consumer Research > Categorical.
3. Select the Related tab.
4. Select 1980 Winner through 2012 Winner, and click Repeated Measures on the Related tab.
5. Click OK.
6. Near the bottom of the report window, click the gray Transition Report disclosure icon to open the Transition Report.
Figure 3.34 Repeated Measures Transition Report
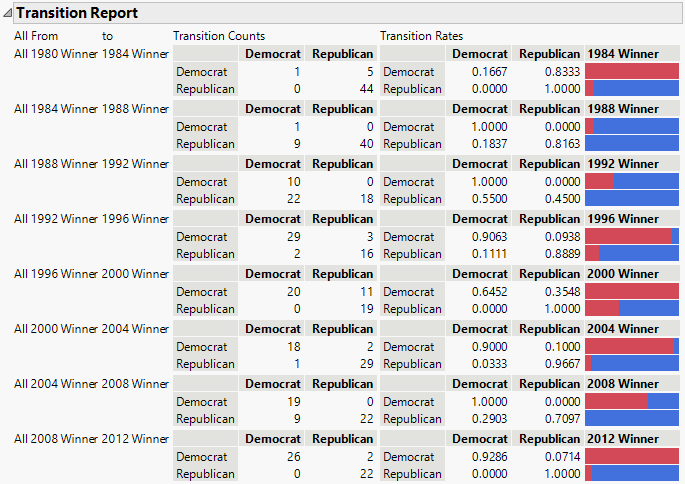
The Transition Report is unique to the repeated measures analysis. This report includes counts and rates of differences between subsequent time points. Between 1980 and 1984, there were 5 Democratic states that transitioned to Republican states at a rate of 0.8333 or 5 out of 6 states. In 1980, they voted Democratic but voted Republican in 1984. Between 2008 and 2012, there were 2 out of 28 Democratic states that transitioned to Republican at a rate of 0.0714. All other states voted the same way in both the 2008 and 2012 elections.