Example of the Distribution Platform
Suppose that you have data on 40 students, and you want to see the distribution of age and height among the students.
1. Select Help > Sample Data Library and open Big Class.jmp.
2. Select Analyze > Distribution.
3. Select age and height and click Y, Columns.
4. Click OK.
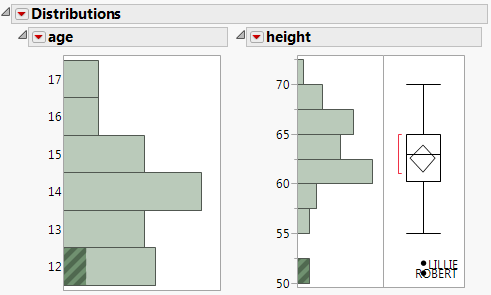
Figure 3.2 Example of the Distribution Platform
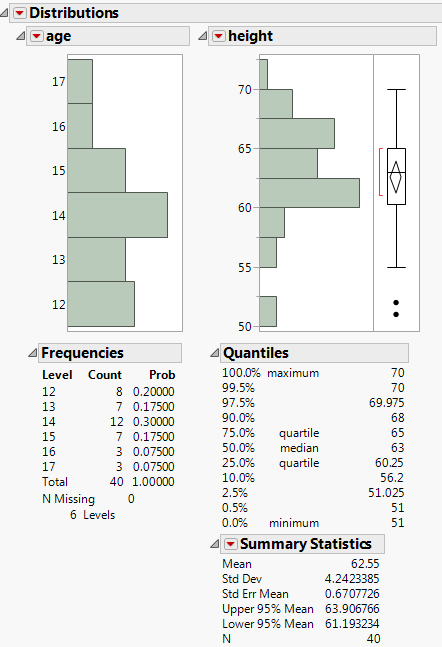
From the histograms, you notice the following:
• The ages are not uniformly distributed.
• For height, there are two points with extreme values (that might be outliers).
Click the bar for 50 in the height histogram to take a closer look at the potential outliers.
• The corresponding ages are highlighted in the age histogram. The potential outliers are age 12.
• The corresponding rows are highlighted in the data table. The names of the potential outliers are Lillie and Robert.
Add labels to the potential outliers in the height histogram.
1. Select both outliers.
2. Right-click one of the outliers and select Row Label.
Label icons are added to these rows in the data table.
3. Resize the box plot wider to see the full labels.
Figure 3.3 Potential Outliers Labeled