Publication date: 07/30/2020
Example Using a By Variable
1. Select Help > Sample Data Library and open Lipid Data.jmp.
2. Select Analyze > Distribution.
3. Select Cholesterol and click Y, Columns.
4. Select Gender and click By.
This results in a separate analysis for each level of Gender (female and male).
5. Click OK.
Change the orientation of the histograms and the reports.
6. Click the Distributions red triangle and select Stack.
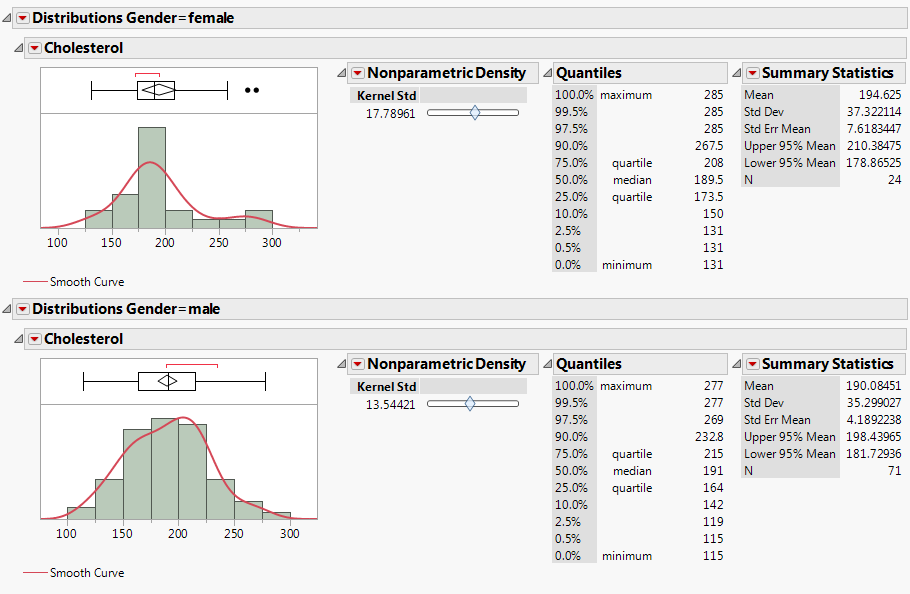
Add a smooth curve to both histograms.
7. Hold down the Ctrl key. Click the Cholesterol red triangle and select Continuous Fit > Smooth Curve.
Figure 3.14 Separate Distributions by Gender
Want more information? Have questions? Get answers in the JMP User Community (community.jmp.com).