Example Using a Supplementary ID
The United States census allows for examining population growth over the last century. The US Regional Population.jmp sample data table contains populations of the 50 US states grouped into regions for each of the census years from 1920 to 2010. Alaska and Hawaii are treated as supplementary regions because they were not states during the entire time, and they are not part of the contiguous United States. You are interested in whether the population growth in these two states differs from the rest of the US.
1. Select Help > Sample Data Library and open US Regional Population.jmp.
2. Select Analyze > Multivariate Methods > Multiple Correspondence Analysis.
3. Select Year and click Y, Response.
4. Select Region and click X, Factor.
5. Select ID and click Supplementary ID.
6. Select Population and click Freq.
7. Click OK.
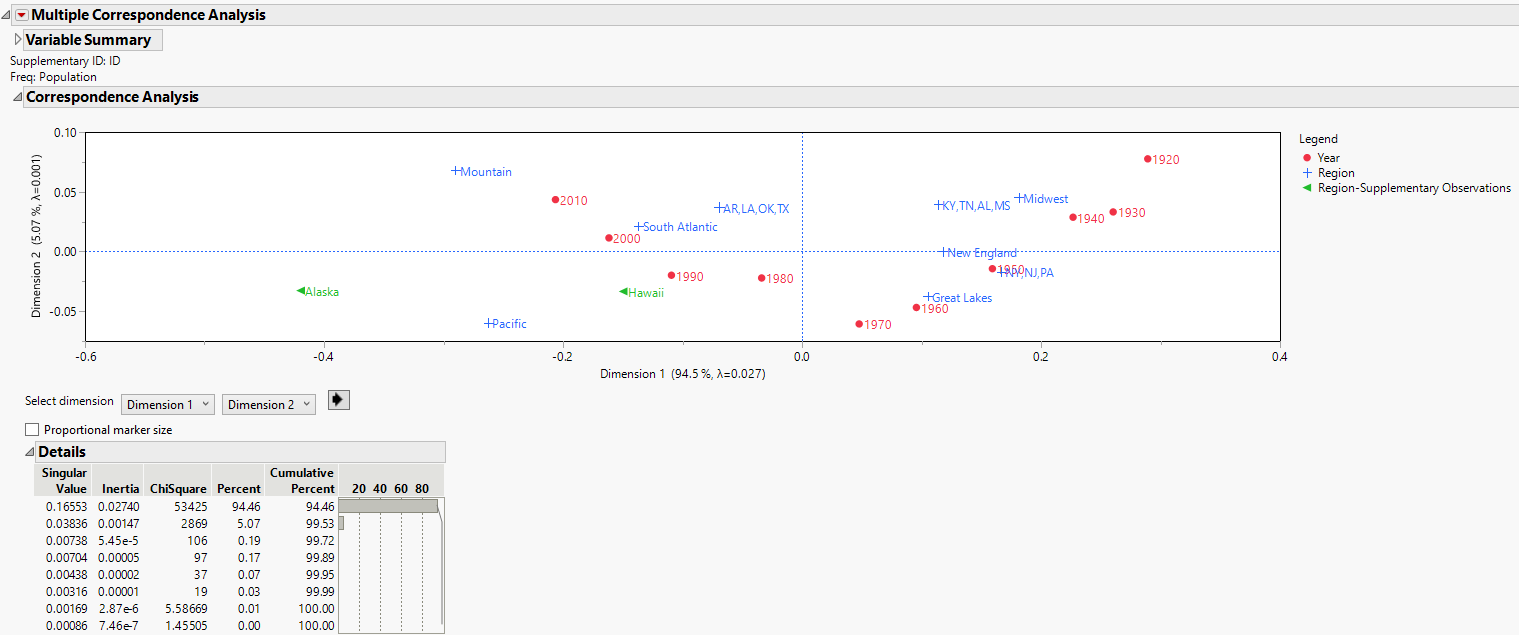
The Details report shows that the association between years and regions is almost entirely explained by the first dimension. The plot shows that years are in the correct order on the first dimension. This ordering occurs naturally through the correspondence analysis; there is no information about the order provided to the analysis. The plot highlights the isometric scale used to plot the data.
Notice that the ordering of the regions reflects the population shift from the Midwest to the Northeast to the South and finally to the Mountain and West.
Alaska and Hawaii were not used in the computation of the analysis but are plotted based on the results. Their growth pattern is most similar to the Pacific states. Alaska’s growth is even more extreme than the Pacific region.
Figure 7.7 MCA with Supplementary ID Report