Find the Critical Point Using the Prediction Profiler
The Prediction Profiler report shows the quadratic behavior of the response surface along traces for X1 and X2. Because the Response Limits column property is set for Y, the profiler also shows desirability functions.
Figure 4.15 Prediction Profiler with Match Target as Goal
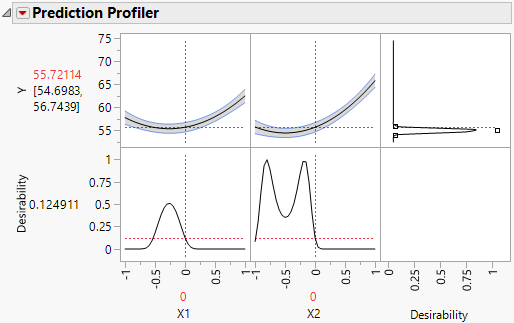
The goal for the Response Limits column property is set to Match Target. But for this example, you are interested in minimizing Y, not matching a target. Change this setting as follows:
1. Press Ctrl and click in the top right cell of the Prediction Profiler.
2. In the Response Goal dialog, select Minimize from the list of options.
3. Click OK.
The desirability function now reflects your goal of minimizing Y.
4. Click the Prediction Profiler red triangle and select Optimization and Desirability > Maximize Desirability.
Figure 4.16 Prediction Profiler with Minimize as Goal and Desirability Maximized
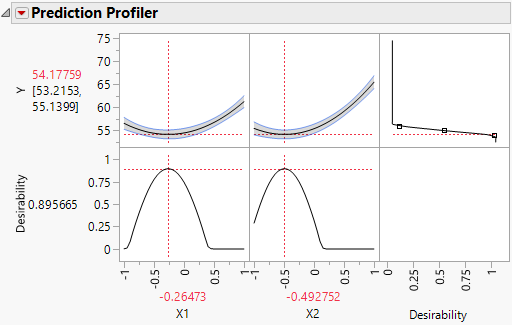
Settings within the design region that minimize Y appear under the profiler. Note that these are precisely the Critical Values given in the Solution report.