Fit Competing Risk Mixture Example
In this example, you compare the fit of a single Weibull distribution to a competing risk mixture distribution with two Weibull fits.
1. Select Help > Sample Data Library and open Reliability/Mixture Demo.jmp.
2. Select Analyze > Reliability and Survival > Life Distribution.
3. Select Y2 and click Y, Time to Event.
4. Click OK.
5. In the Compare Distributions report, select Weibull distribution and the corresponding Scale radio button.
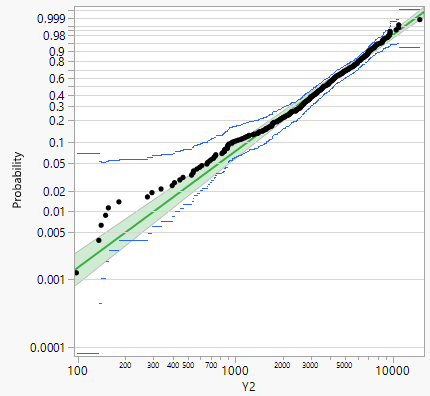
A probability plot for a single Weibull distribution fit appears. Note that the fit is not very good in the lower part of the range of Y2.
Figure 3.23 Weibull Distribution Fit
6. Click the Life Distribution red triangle and select Fit Competing Risk Mixture.
7. Scroll down to the Competing Risk Mixture report. Next to Weibull, type 2 in the Quantity box.
8. Click Go.
9. Scroll up to the Compare Distributions report. In the probability plot, right-click the vertical axis and select Edit > Copy Axis Settings.
10. Scroll down to the Competing Risk Mixture report. In the overlay plot, right-click the vertical axis and select Edit > Paste Axis Settings.
11. Do the same for the horizontal axis. In the probability plot, right-click the horizontal axis and select Edit > Copy Axis Settings.
12. In the overlay plot, right-click the horizontal axis and select Edit > Paste Axis Settings.
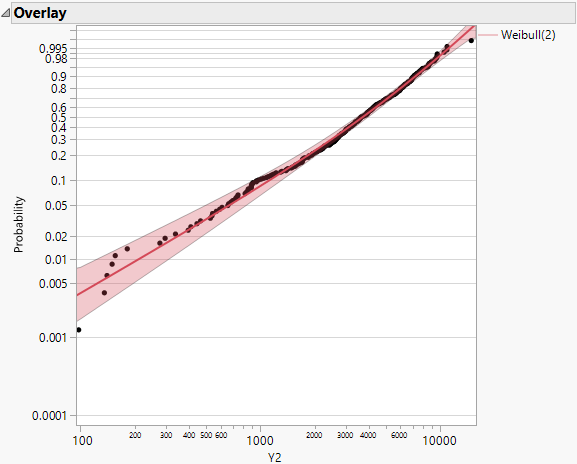
The probability plot for the Weibull(2) distribution fit appears. Note that the mixture of two Weibull distributions helps better capture the distribution in the lower part of the range of Y2.
Figure 3.24 Weibull(2) Competing Risk Mixture Distribution Fit