Publication date: 07/30/2020
Fitted Distribution Plots
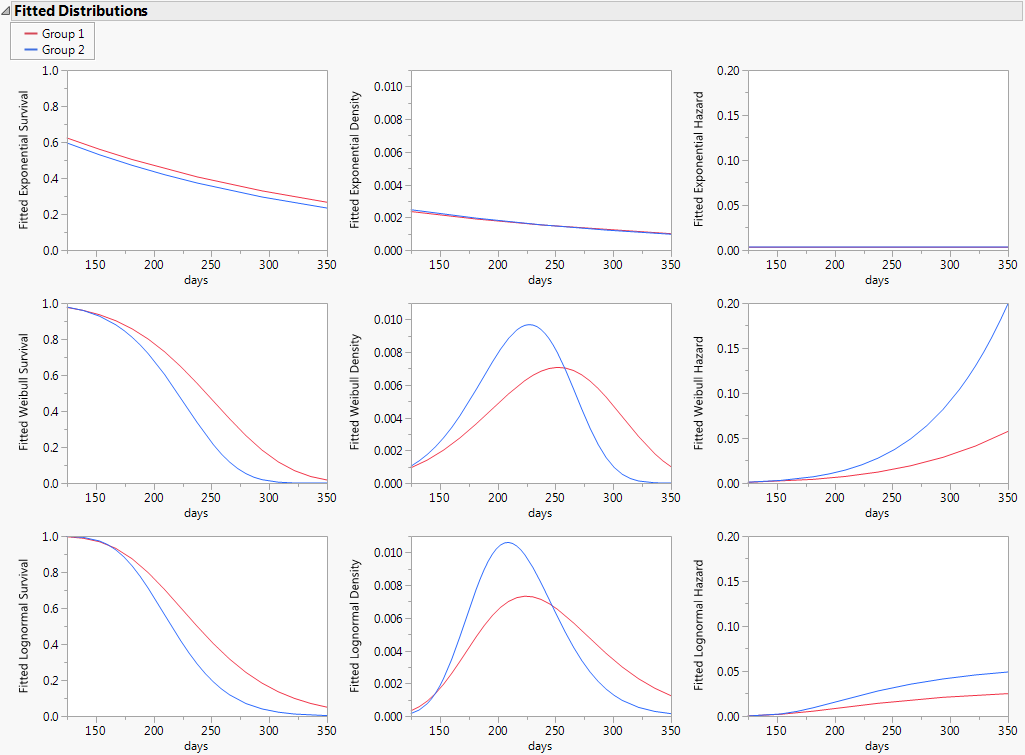
Use the Fitted Distribution Plots option to see Survival, Density, and Hazard plots for the exponential, Weibull, and lognormal distributions. The plots share the same axis scaling so that the distributions can be easily compared.
Figure 13.7 Fitted Distribution Plots for Three Distributions
These plots can be transferred to other graphs through the use of graphic scripts. To copy the graph, right-click in the plot to be copied and select Edit > Copy Frame Contents. Right-click in the destination plot and select Edit > Paste Frame Contents.
Want more information? Have questions? Get answers in the JMP User Community (community.jmp.com).