Launch the Overlay Plot Platform
Launch Overlay Plot by selecting Graph > Legacy > Overlay Plot.
Figure A.6 The Overlay Plot Launch Window
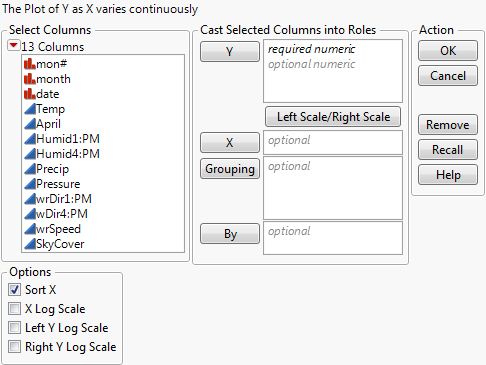
In the Overlay Plot Launch window, you assign the following:
• one X variable of any modeling type
• as many numeric Y variables as you want
Cast Selected Columns Into Roles
X, Y
You can graph many numeric Y variables against a single X variable.
Left Scale/Right Scale
The columns assigned to the Y role have a left- or right-pointing arrow to the left of the column name. This arrow designates on which vertical axis (on the left or right of the plot) the variable appears. Change the designation by highlighting the column in the Y list and clicking the Left Scale/Right Scale button.
Grouping
This option produces a matrix of graphs for each Grouping variable.
By
This option produces a separate graph for each level of the By variable. If two By variables are assigned, a separate graph for each possible combination of the levels of both By variables is produced.
Options
Sort X
This option causes the points to be connected in order of ascending X values. Otherwise, the points are connected in row order. This option is selected by default.
X Log Scale
This option applies a log scale to the x-axis.
Left Y Log Scale
This option applies a log scale to the left y-axis. It is available only if one or more Y variables are left-scaled. (See Left Scale/Right Scale.)
Right Y Log Scale
This option applies a log scale to the right y-axis. It is available only if one or more Y variables are right-scaled. (See Left Scale/Right Scale.)
After you click OK, the Overlay plot appears. See The Overlay Plot.