Lenth t-Ratios
For each contrast, a t-ratio is computed by dividing the contrast by the PSE. The reference distribution of these t-ratios under the null hypothesis is not computationally tractable. Therefore, it is obtained by simulation. The method, described below, is based on a discussion in Ye and Hamada (2000).
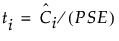
Denote the t-ratio for the ith contrast by ti:
Of primary importance in screening experiments is the individual error rate, namely the probability of declaring a given effect as active when it is not. For the ith effect, this occurs when |ti| is large and falls into the upper tail of its reference distribution.
Because the platform constructs a relatively large number of effects, the experimentwise error rate is also of importance. The experimentwise error rate is the probability of declaring any effect as active when no effects are active. An experimentwise error occurs when no effects are active and the maximum of the absolute t-ratios, max|ti|, is large and falls into the upper tail of its reference distribution.
The Fit Two Level Screening platform obtains reference distributions for both types of error rates using Monte Carlo simulation. Consider a set of n - 1 values that is simulated from a normal distribution with mean 0 and standard deviation equal to PSE. This set of values represents potential contrast values for the experiment under the null hypothesis of no active effects. In all, 10,000 sets of n - 1 random contrast values are generated.
Individual p-Values
Consider the ith contrast. Lenth t-ratios are constructed using each of the 10,000*(n - 1) simulated values. The reference distribution for the individual error rate is approximated by the absolute values of these t-ratios. The Individual p-value is the interpolated fractional position of the observed absolute Lenth t-Ratio among the 10,000*(n - 1) simulated absolute t-ratios arranged in descending order. This approximates the area to the right of the absolute value of the observed absolute Lenth t-Ratio with respect to the reference distribution.
Simultaneous p-Values
An experimentwise error occurs if any t-ratio leads to rejecting the null hypothesis when all effects are inactive. Equivalently, an experimentwise error occurs if the maximum of the absolute t-ratios, max|ti|, leads to rejecting the null hypothesis.
To obtain a reference distribution in this case, consider the maximum of the computed absolute t-ratios in each of the 10,000 simulations. These 10,000 maximum values form the reference distribution. The Simultaneous p-value is the interpolated fractional position of the observed absolute Lenth t-Ratio among the 10,000 simulated maximum absolute t-ratios arranged in descending order. This approximates the area to the right of the absolute value of the absolute Lenth t-Ratio with respect to the reference distribution based on the simulated maximum absolute t-ratios.
Monte Carlo Simulation Options
To change the number of default sets of simulations from 10,000, you must assign a value to a global JSL variable named LenthSimN. The number of simulations used to derive the p-values is reported in the report window.
The following example sets the number of simulations to 50,000.
1. Select Help > Sample Data Library and open Reactor Half Fraction.jmp.
2. Select DOE > Classical > Two Level Screening > Fit Two Level Screening.
3. Select Percent Reacted and click Y.
4. Select Feed Rate through Concentration, click X, and then click OK.
5. Click the red triangle next to Screening for Percent Reacted and select Save Script > To Script Window.
6. Insert LenthSimN=50000; as the first line of the script.
LenthSimN=50000;
Fit Two Level Screening(Y( :Percent Reacted),
X( :Feed Rate, :Catalyst, :Stir Rate, :Temperature, :Concentration )
);
7. Right-click in the script window and select Run Script.
Figure 10.10 Fit Two Level with N = 50,000 Simulations for p-Value Derivations
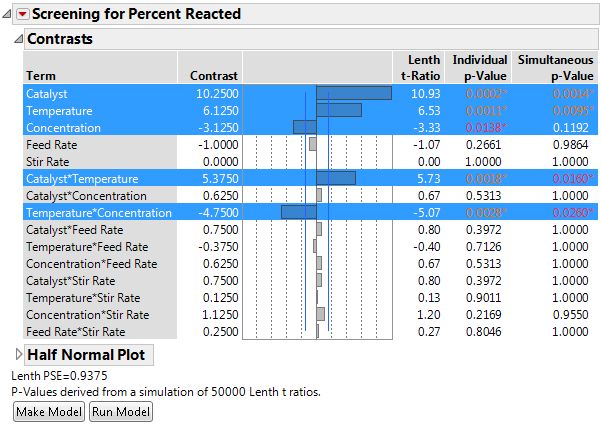
The number of simulations is stated in the report window.
Note: If LenthSimN=0, the standard t-distribution is used and simultaneous p-values are not provided. This approach is not recommended.