Publication date: 07/30/2020
Mean Lines, Error Bars, and Standard Deviation Lines
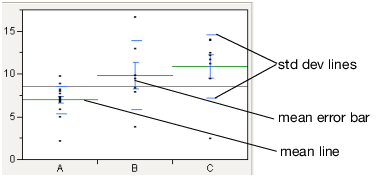
Show mean lines by selecting Display Options > Mean Lines. Mean lines indicate the mean of the response for each level of the X variable.
Mean error bars and standard deviation lines appear when you select the Means and Std Dev option from the red triangle menu. To turn each option on or off singly, select Display Options > Mean Error Bars or Std Dev Lines.
Figure 6.9 Mean Lines, Mean Error Bars, and Std Dev Lines
Want more information? Have questions? Get answers in the JMP User Community (community.jmp.com).