Model Comparison Report
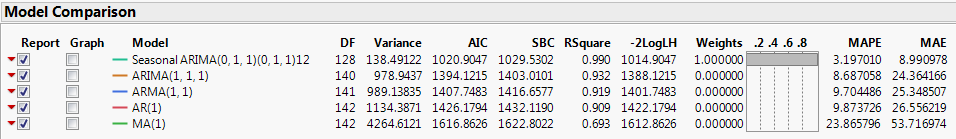
Once a model is fit, the Model Comparison Report is displayed in the report window. This report contains the Model Comparison table and plots for the models. Each time a new model is fit, a new row is added to the Model Comparison table, with a unique color-coding. The Model Comparison table summarizes the fit statistics for each model and is used to compare several models fitted to the same time series. By default, the models are sorted by the AIC statistic, in decreasing order. To sort the model by a different statistic, right-click any column in the Model Comparison Table and select Sort by Column. For definitions of the fit statistics, see Model Summary Table. The only fit statistic that is unique to the Model Comparison Table is Weights. This fit statistic is the normalized AIC Weight. The AIC Weight for a model is calculated as follows:

K is the total number of models, AICk is the AIC value for model k, and BestAIC is the AIC value for the model with the minimum AIC value.
Figure 17.12 Model Comparison Table
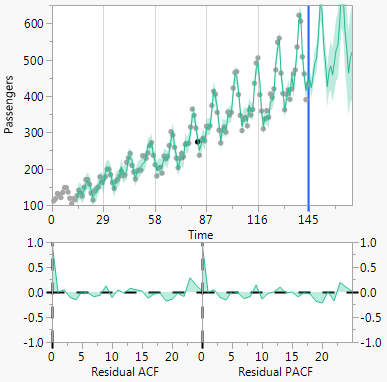
You can select which full model reports are shown in the report window using the Report check box. Two model plots appear to the right of the Model Comparison table. The top plot is a time series plot of the data, forecasts, and prediction limits. Below that are plots of the autocorrelation and partial autocorrelation functions. You can select which models are displayed on the model plots using the Graph check box.
Figure 17.13 Model Plots
Model Comparison Report Options
Each model in the Model Comparison report has the following red triangle menu options:
Fit New
Opens a specification window for the model. You can change the settings to fit a different model.
Simulate Once
Provides one simulation of the model out k time periods. The simulation is shown on the Model Comparison time series plot. To change k, use the Number of Forecast Periods option in the Time Series red triangle menu.
Simulate More
Provides the specified number of simulations of the model out k time periods. The simulations are shown on the Model Comparison time series plot. To change k, use the Number of Forecast Periods option in the Time Series red triangle menu.
Remove Model Simulation
Removes the simulations for the model.
Remove All Simulation
Removes the simulations for all models.
Generate Simulation
Generates simulations for the model, and stores the results in a data table. You can specify the random seed, number of simulations, and the number of forecast periods.
Set Seed
Specifies the seed for generating the simulated forecast values.
Note: The Time Series platform treats excluded rows as missing values. If the last several observations in the data table are excluded, the simulation options in the Model Comparison Report will not work properly. This is because the simulation procedure uses the last several observations of the time series. If the last several observations are missing, the simulation produces all missing values into the future.