Publication date: 07/30/2020
Quantiles
The Quantiles report lists selected percentiles for each level of the X factor variable. The median is the 50th percentile, and the 25th and 75th percentiles are called the quartiles.
The Quantiles option adds the following elements to the plot:
• the grand mean representing the overall mean of the Y variable
• outlier box plots summarizing the distribution of points at each factor level
Figure 6.6 Outlier Box Plot and Grand Mean
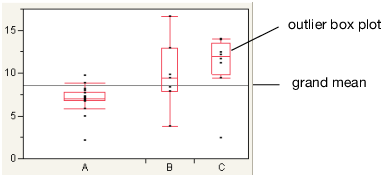
Note: To hide these elements, click the red triangle next to Oneway Analysis and select Display Options > Box Plots or Grand Mean.
Want more information? Have questions? Get answers in the JMP User Community (community.jmp.com).