Save Script Menus
After completing an analysis and receiving a report, you might want to save the process that you used to create the report as a JSL script. You do this by selecting an option from the Script red triangle menu. Most of the Save Script options are the same throughout JMP. A few platforms add extra options that are described in the specific platform chapters. The following Save Script menu options are common to all platforms.
To Data Table
Saves the script to the data table that was used to produce the report. This enables you to run the script again from the data table to re-create the results. Select this option to save a script to the data table.
To Journal
Saves a link in a journal window that runs the script for the analysis. If a journal window is already open, the script is added to that journal window. The script contains the path to the data table. Note that if the data table cannot be found, the script does not run.
To Script Window
Opens a script editor window and adds the script to it. If a script window is already open, the script is added to the bottom of that open window.
To Report
Adds the script to the top of the report window.
Data Table Window
Brings the corresponding data table used to create the report to the front. Available only when the report window contains different platforms.
Script All By-Groups
If you specified a By variable in the launch window, the Save By-Group Script menu enables you to save a script for all levels of the By variable to the script window.
In the Save Script menu, To Data Table (All Objects) and To Script Window (All Objects) save a script for all levels of the By variable.
Automatic Recalc
The Automatic Recalc feature immediately reflects changes that you make to the data table in the corresponding report window. You can make any of the following data table changes:
• exclude or unexclude data table rows
• delete or add data table rows
This powerful feature immediately reflects these changes to the corresponding analyses, statistics, and graphs that are located in a report window.
To turn on Automatic Recalc for a report window, click the platform red triangle and select Redo > Automatic Recalc. To turn it off, deselect the same option. You can also turn on Automatic Recalc using JSL.
Platforms that support Automatic Recalc include a preference in the Platforms preferences.
Note: For some platforms, the Automatic Recalc feature is not appropriate and therefore is not supported. These platforms include the following: DOE, Profilers, Choice, Partition, Nonlinear, Neural, Neural Net, Partial Least Squares, Fit Model (REML, GLM, Log Variance), Gaussian Process, Item Analysis, Cox Proportional Hazard, Response Screening, and Control Charts (except Run Chart).
Column Switcher
Within a report, use the Column Switcher to quickly analyze different variables without having to re-create your analysis. To activate the Column Switcher, from a report window, click the red triangle and select Redo > Column Switcher.
If you have multiple columns, use the buttons to animate the column switching or step through each column manually. Move the slider control to change the speed of the animation.
Note: You cannot copy or move the column switcher within a report. Also, a column switcher cannot be saved to a JMP journal.
Example of the Column Switcher
You have data about nutrition information for candy bars. You want to examine different factors, to see which factors best predict calorie levels.
1. Select Help > Sample Data Library and open Candy Bars.jmp.
2. Select Graph > Graph Builder.
3. Click Total fat g and drag to the X zone.
4. Click Calories and drag to the Y zone.
5. Click Cholesterol g and drag to the Wrap zone.
6. Click the Graph Builder red triangle and select Redo > Column Switcher.
Choose the column that you want to switch from:
7. Select Cholesterol g and click OK.
Choose the columns that you want to switch to:
8. Select Saturated fat g, Cholesterol g, Sodium mg, Carbohydrate g, Dietary fiber g, and Sugars g and click OK.
Figure 9.6 Column Switcher in Graph Builder Window
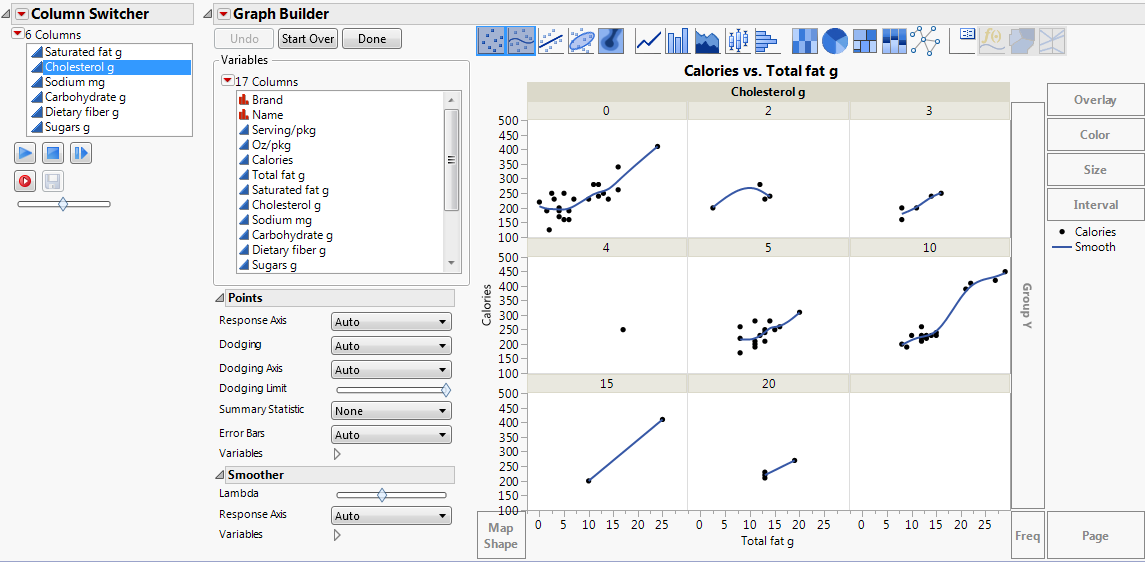
9. Click the Play button to cycle between the different factors. Use the slider to control the speed of the animation. Alternatively, you can step through each factor individually.
You can see that the relationship between calories and fat is relatively strong for each level of carbohydrate. Therefore, Carbohydrate g appears to be the best predictor of calorie levels.
Note: The Record and Save buttons in the Column Switcher record the animation and then save it as an animated GIF. This feature is available only on Windows.