Publication date: 07/30/2020
Scatterplot Matrix
View Multiple Bivariate Relationships Simultaneously
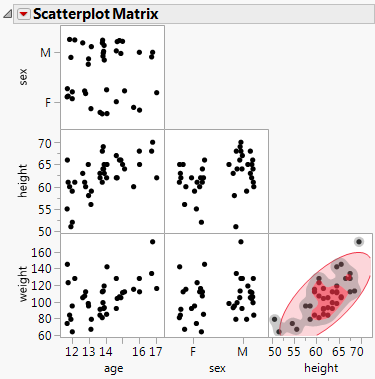
Using the Scatterplot Matrix platform, you can assess the relationships between multiple variables simultaneously. A scatterplot matrix is an ordered collection of bivariate graphs. For further analysis, you can customize the scatterplots with density ellipses for all of your data, or for only groups of your data.
Figure 6.1 Example of a Scatterplot Matrix
Contents
Example of a Scatterplot Matrix
Launch the Scatterplot Matrix Platform
Change the Matrix Format
The Scatterplot Matrix Window
Scatterplot Matrix Platform Options
Example Using a Grouping Variable
Create a Grouping Variable
Want more information? Have questions? Get answers in the JMP User Community (community.jmp.com).