Show Fit Details
Figure 4.12 Fit Details for Categorical Response (Y Binary from Diabetes.jmp)
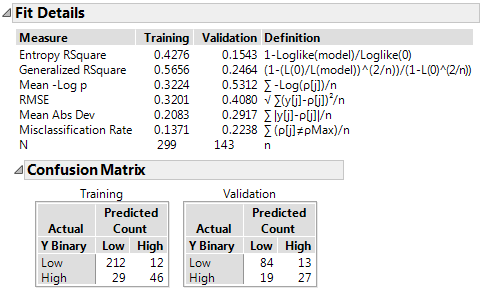
Entropy RSquare
A measure of fit that compares the log-likelihoods from the fitted model and the constant probability model. Entropy RSquare ranges from 0 to 1, where values closer to 1 indicate a better fit. See Entropy RSquare in the Statistical Details section.
Generalized RSquare
A measure that can be applied to general regression models. It is based on the likelihood function L and is scaled to have a maximum value of 1. The Generalized RSquare measure simplifies to the traditional RSquare for continuous normal responses in the standard least squares setting. Generalized RSquare is also known as the Nagelkerke or Craig and Uhler R2, which is a normalized version of Cox and Snell’s pseudo R2. See Nagelkerke (1991). Values closer to 1 indicate a better fit.
Mean -Log p
The average of -log(p), where p is the fitted probability associated with the event that occurred. Smaller values indicate a better fit.
RMSE
The root mean square error, where the differences are between the response and p (the fitted probability for the event that actually occurred). Smaller values indicate a better fit.
Mean Abs Dev
The average of the absolute values of the differences between the response and p (the fitted probability for the event that actually occurred). Smaller values indicate a better fit.
Misclassification Rate
The rate for which the response category with the highest fitted probability is not the observed category. Smaller values indicate a better fit.
The Confusion Matrix report shows matrices for the training set and for the validation and test sets (if defined). The Confusion Matrix is a two-way classification of actual and predicted responses.
If the response has a Profit Matrix column property, or if you specify costs using the Specify Profit Matrix option, then a Decision Matrix report appears. See Decision Matrix Report.