Statistical Details for the Model Driven Multivariate Control Chart Platform
T2 Values
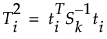
The  value for each of the i observations is plotted on the T2 control chart. For historical and current data, the T2 values for a PCA or PLS model with k components are defined as:
where:
ti = the vector of k scores for the ith observation
Sk = the diagonal sample covariance matrix of the k scores for historical observations
For PCA models,  is the diagonal eigenvalue matrix.
The mean of each of the k historical score vectors is 0 when the data is centered during the data preprocessing step. This step occurs in PCA on correlations or covariances and in PLS with centering. For preprocessing options where X is not centered, the mean of each of the k score vectors is 0 by assumption. For more information about Hotelling’s T2, see Montgomery (2013).