 Support Vector Machine Model Report
Response Profile Plot
Gives a visual representation of the classification model. The points on the plot are the actual data observations. For the two variables plotted, the shaded contours represent a plane of the prediction space determined by fixed values of the remaining model factors. The predictions are based on the classification decision rule that is calculated by the platform. Controls for the fixed values are located above the plot. When you change the fixed values of the factors, using either the slider or number box, the prediction space for the plotted variables is automatically updated. You can also change the axes of the plot to display any continuous factor using the red triangles on each axis.
The Response Profile Plot red triangle menu contains an option to change the grid density of the plot. This option determines the fineness of the prediction grid underlying the shaded contours. A higher grid density provides a smoother decision line.
Model Summary
Gives the name of the response column, the validation method, and the type of kernel function used in the model fit. The Model Summary table also contains information about the model fit for the training, validation, and test sets. The number of observations, the misclassification rate, and the number of support vectors are reported for each set. The misclassification rate is the proportion of observations misclassified by the model. This is calculated as the number of misclassifications divided by the total number of observations.
Estimation Details
Gives the values of the parameters used in the model.
Fit Details
Gives the following statistics for the training set, and for the validation and test sets if they are specified:
Entropy RSquare
A measure of fit that compares the log-likelihoods from the fitted model and the constant probability model. Entropy RSquare ranges from 0 to 1, where values closer to 1 indicate a better fit. See Entropy RSquare in the Statistical Details section.
Generalized RSquare
A measure that can be applied to general regression models. It is based on the likelihood function L and is scaled to have a maximum value of 1. The Generalized RSquare measure simplifies to the traditional RSquare for continuous normal responses in the standard least squares setting. Generalized RSquare is also known as the Nagelkerke or Craig and Uhler R2, which is a normalized version of Cox and Snell’s pseudo R2. See Nagelkerke (1991). Values closer to 1 indicate a better fit.
Mean -Log p
The average of -log(p), where p is the fitted probability associated with the event that occurred. Smaller values indicate a better fit.
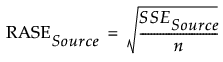
RASE
The square root of the mean squared prediction error (Root Average Square Error). RASE is computed as follows, where Source indicates the Training, Validation, or Test set.
Mean Abs Dev
The average of the absolute values of the differences between the response and the predicted response. The differences are between 1 and p, the fitted probability for the response level that actually occurred. Smaller values indicate a better fit.
Misclassification Rate
The rate for which the response category with the highest fitted probability is not the observed category.
Note: The misclassification rates in the Fit Details report might not match the misclassification rates in the Confusion Matrix report. When the response is binary, the rates in the Fit Details report use a probability cutoff of 0.5, but the rates in the Confusion Matrix report use the probability threshold value as the cutoff.
N
The number of observations.
Confusion Matrix
A confusion matrix is shown for each set (training, validation, and test) specified in the model. A confusion matrix is a two-way classification of actual and predicted responses. Use the confusion matrices and the misclassification rates to evaluate your model.
The confusion matrices and the misclassification rates use the value in the probability threshold box as the cutoff value. By default, this value is based on the classification decision rule that is calculated by the platform. You can change the cutoff value by dragging the slider or entering a new value in the box next to Probability Threshold. If you change the probability threshold, the confusion matrices and misclassification rates automatically update. The probability threshold and conditional validation misclassification rate columns in the Model Comparison report are also updated.