The Factor Analysis Report
The initial Factor Analysis report shows Eigenvalues and the Scree Plot. The eigenvalues are obtained from a principal components analysis. The scree plot graphs these eigenvalues. The initial number of factors in the Model Launch equals the number of eigenvalues that exceed 1.0. You can change the number of factors to extract.
Use the scree plot as a guide for the number of factors. The number of eigenvalues before the scree plot levels out provides an upper bound on the number of factors. For this example, two components (factors) are suggested by the scree plot.
Figure 9.5 Factor Analysis Report
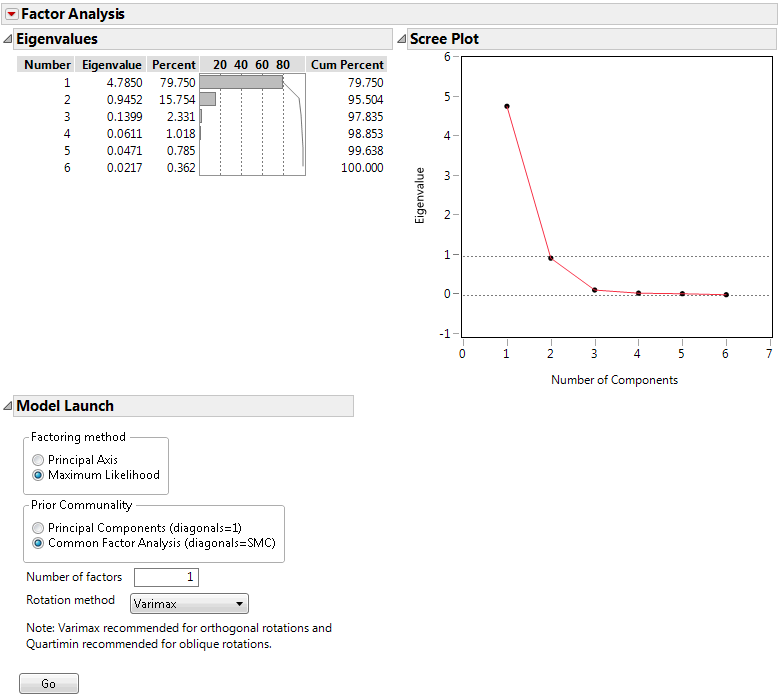
The Eigenvalues table indicates that the first eigenvalue accounts for 79.75% of the variation and the second eigenvalue accounts for 15.75%. Therefore, the first two eigenvalues account for 95.50% of the total variation. The third eigenvalue explains only 2.33% of the variation, and the contributions from the remaining eigenvalues are negligible. Although the Number of factors box is initially set to 1, this analysis suggests that it is appropriate to extract 2 factors.