The Fit Group Orthogonal Supersaturated Report
The Fit Group Orthogonal Supersaturated Report has two sections. The first section reports the estimates of active effects within each group, fitting one group at a time. Only active groups are shown. This is Stage 1 of the analysis. In Stage 2 a combined model is constructed
Figure 26.5 Stage 1 Findings
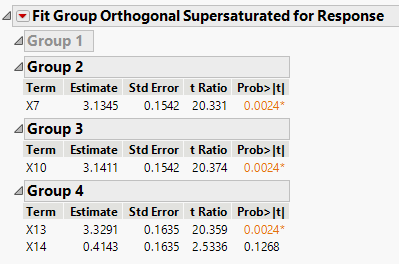
Term
Main effects that are identified as active.
Estimate
Parameter estimate for a regression fit of Y on the main effect.
Std Error
The standard error of the estimate, computed using the fake factors in Group 1.
t Ratio
The Estimate divided by its Std Error.
Prob>|t|
The p-value computed using the t Ratio and the degrees of freedom for error (DF).
The second section of the report contains the results of Stage 2 of the analysis. Stage 2 constructs the model used to evaluate the design results.
Figure 26.6 Stage 2 Results
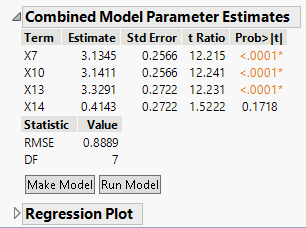
Term
Main effects that are identified as active.
Estimate
Parameter estimate for a regression fit of Y on the main effect.
Std Error
The standard error of the estimates obtained by fitting the specified model and intercept using the full data set.
t Ratio
The Estimate divided by its Std Error.
Prob>|t|
The p-value computed using the t Ratio and the degrees of freedom for error (DF).
RMSE
The square root of the mean square error.
DF
The degrees of freedom associated with the error estimate used to construct the RMSE.