The Mixture Profiler
The Fit Model report also has a Mixture Profiler that is useful for visualizing and optimizing response surfaces from mixture experiments. Many of the features are the same as those of the Contour Profiler. However, some are unique to the Mixture Profiler:
• A ternary plot is used instead of a Cartesian plot, which enables you to view three mixture factors at a time.
• If you have more than three factors, radio buttons let you choose which factors to plot.
• If the factors have constraints, you can enter their low and high limits in the Lo Limit and Hi Limit columns. This setting shades non-feasible regions in the profiler.
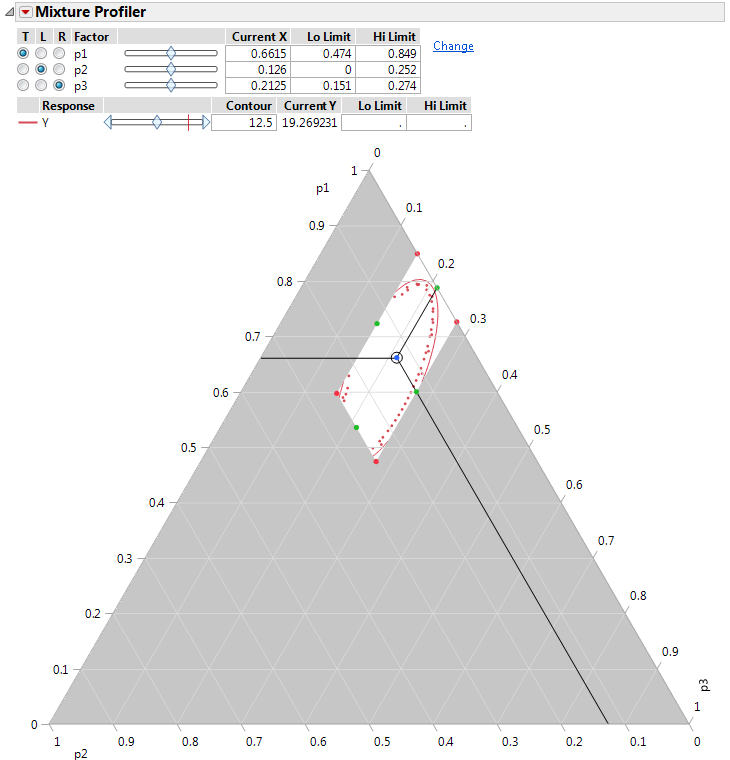
Click the Response Y red triangle ands elect Factor Profiling > Mixture Profiler to see the mixture profiler for the plasticizer data.
Figure 13.26 Mixture Profiler for Plasticizer Example