Publication date: 07/30/2020
The Model Driven Multivariate Control Chart Report
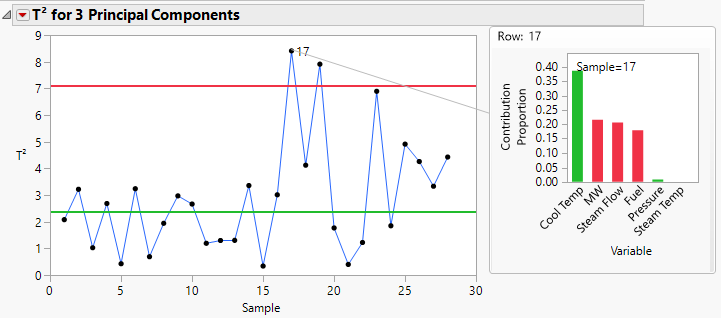
The initial Model Driven Multivariate Control Chart Report shows a T2 control chart. The hover labels on the chart are themselves charts. Click the hover label charts to open larger versions of the charts. Depending on the chart, they open in a separate report window or in the Diagnosis the Process section of the MDMVCC report. You can use the graphlets to interactively drill down into the data.
Figure 11.7 MDMVCC Report with a Hover Graphlet
Want more information? Have questions? Get answers in the JMP User Community (community.jmp.com).