 The Naive Bayes Report
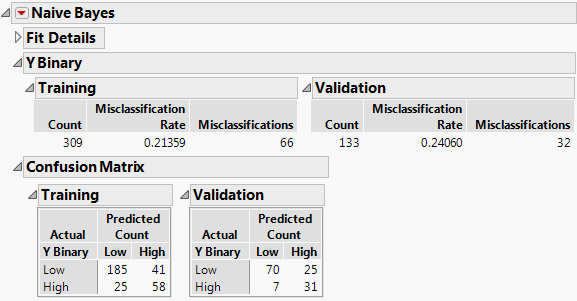
After you click OK in the launch window, the Naive Bayes report appears. By default, the Naive Bayes report contains reports for fit details, the response column, the Confusion Matrix, and the ROC curves.
Figure 8.7 Naive Bayes Report
 Fit Details Report
The Fit Details report shows various measures of fit for the model for the Training set, and for the Validation and Test sets if they are specified. The Measure column lists the different fit statistics and the Definition column shows the formulas for the corresponding fit statistics. See Measures of Fit for Categorical Responses in the Model Comparison section. By default, the Fit Details report in the Naive Bayes report window is closed.
 Response Column Report
The response column report shows performance statistics for the naive Bayes classification in a summary table for the Training set, and the Validation and Test sets if they are specified. The summary tables contain the following columns:
Count
The number of observations in the set corresponding to the table (Training, Validation, or Test set).
Misclassification Rate
Proportion of observations in the corresponding set that are misclassified by the model. This is calculated as Misclassifications divided by Count.
Misclassifications
The number of observations in the corresponding set that are classified incorrectly.
 Confusion Matrix Report
The Confusion Matrix report shows a confusion matrix for the Training set, and for the Validation and Test sets if they are specified. A confusion matrix is a two-way classification of actual and predicted responses.
 ROC Curves
The report displays the Receiver Operating Characteristic (ROC) curve for the Training set, and for the Validation and Test sets if they are specified. The ROC curve measures the ability of the fitted probabilities to classify response levels correctly. The further the curve from the diagonal, the better the fit. An introduction to ROC curves is found in ROC Curves in Basic Analysis.
If the response has two levels, the ROC curve plot displays an ROC curve for the first level of the response only. If the response has more than two levels, the ROC Curve plot displays a sub-outline of the curves for each response level. For a given response level, this curve is the ROC curve for correct classification into that level. See ROC Curve in the Partition Models section for more information about ROC curves.