Transfer Function Report
Each transfer function model is added to the Model Comparison table. If the Report check box for a transfer function model in the Model Comparison table is selected, a Transfer Function Model report is produced. Each Transfer Function Model report contains the following reports:
• Model Summary
• Parameter Estimates
• Residuals
• Interactive Forecasting
• Iteration History
The information in the Model Summary, Parameter Estimates, Residuals, and Iteration History reports is the same as in the Time Series report. For more information about these reports, see Model Report. The Parameter Estimates table is followed by the formula of the model, where B is the backshift operator.
Interactive Forecasting
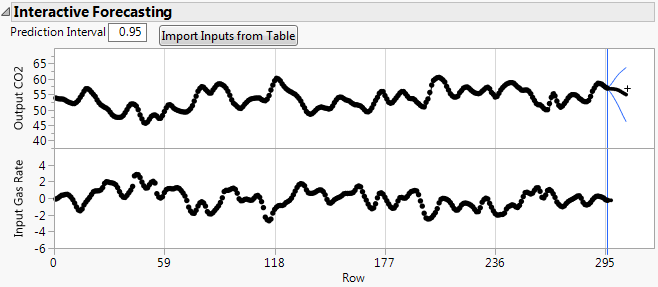
The Interactive Forecasting report provides a forecasting graph based on a prediction interval specified in the Transfer Function Specification window. The prediction interval around the prediction is shown in blue. Change the confidence level for this prediction interval by entering a number in the Prediction Interval box above the graph.
You can drag the plus sign in the graph to change the number of forecast periods in the graph. In the forecast periods, you can change the input values using the Import Inputs from Table button or by dragging points in the input graph to different values. The results of your changes are reflected in the forecast periods of the output graph.
Figure 17.14 Interactive Forecasting Graph