Add a Statistics Column to an Existing Summary Table
After you have created a summary table, you can add columns of descriptive summary statistics for any numeric column in the source table. To do so, from an existing summary table, click the upper red triangle in the data grid and select Add Statistics Column.
Example of Adding a Statistics Column to an Existing Table
Suppose that you have already created a summary table, and you want to add more statistics to the existing summary table.
1. Select Help > Sample Data Library and open Companies.jmp.
2. Select Tables > Summary.
3. Select Type and Size Co and click Group.
4. Click OK.
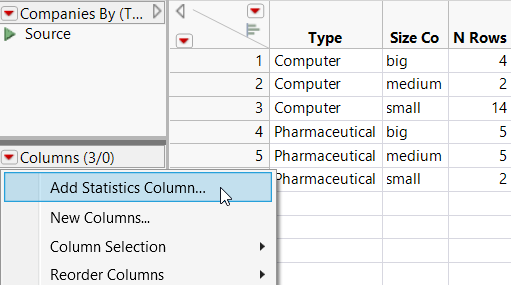
5. Click the red triangle in the upper left corner of the data table grid, select Add Statistics Column.
Figure 8.3 Creating a Summary Statistics Column from Within a Data Table
A modified version of the Summary window appears.
6. Select the column that you want, click Statistics, and select the specific statistic that you want. For this example, select profit/emp and click Statistics, and then select Mean.
7. Click OK.
Figure 8.4 Example of a Summary Table with a Summary Statistics Column
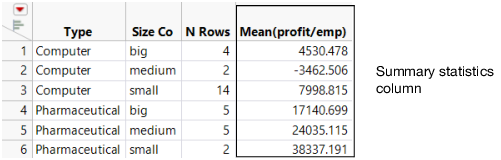
The Mean(profit/emp) column is added to the existing summary table.