Additional Example of Contour Plots
This example illustrates how to create a triangulation data table, to transform the triangulation to use Delaunay triangles, and to filter Alpha shapes of the triangles.
1. Select Help > Sample Data Library and open Cities.jmp.
2. Select Graph > Contour Plot.
3. Select OZONE and click Y.
4. Select X and Y and click X.
5. Select to Fill Areas.
6. Click OK.
7. Click the red triangle next to Contour Plot for OZONE and select the following options:
a. Transform > Range Normalized
Instead of Delaunay triangulation, this changes the method for calculating the triangulations to a normalized scale ([0,1]) in both X and Y.
b. Show Control Panel
The Alpha slider appears.
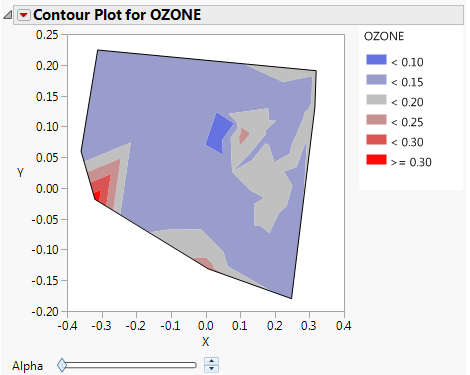
Figure 10.10 Contour Plot for OZONE
8. Click and move the Alpha slider to the right.
Figure 10.11 Alpha Shapes Filter
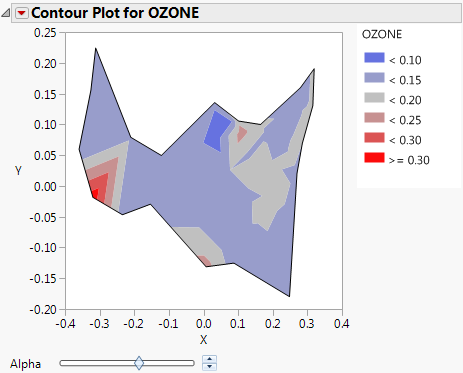
Using the Alpha slider filters out the larger Delaunay triangulation areas.