Additional Example of the Explore Patterns Utility
The Water Treatment.jmp data table contains data from an urban waste water treatment plant. The columns are daily measurements of different sensors in the plant. Use the Explore Patterns Utility to determine whether there are any unexpected patterns in the sensor measurements.
1. Select Help > Sample Data Library and open the Water Treatment.jmp sample data table.
2. Select Analyze > Screening > Explore Patterns.
3. Select the Sensor Measurements column group and click Y, Columns.
4. Click OK.
5. In the Control Panel, under Across Columns, click the box next to Duplicates Across Columns.
Figure 20.18 Duplicates Across Columns Report
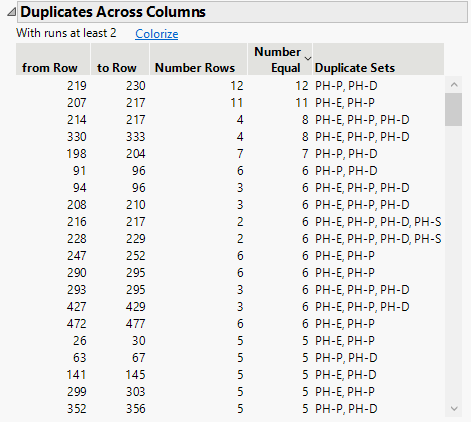
The Duplicates Across Columns report shows a long list of duplicate columns. However, the minimum run size is 2 and there are many small runs in the list. You want to focus on the larger runs of at least 10.
6. In the Control Panel, under Settings, enter 10 in the box next to Minimum Cross Column Duplicate Run Size.
Tip: Click anywhere outside of the box to automatically update the report.
Figure 20.19 Duplicates Across Columns Report With Runs at Least 10
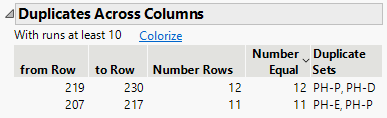
The updated Duplicates Across Columns report shows that there are two duplicate sets with runs of at least 10. Both sets include the PH-P column.
7. Click Colorize in the Duplicates Across Columns Report.
Figure 20.20 Colorized Water Treatments.jmp Data Table
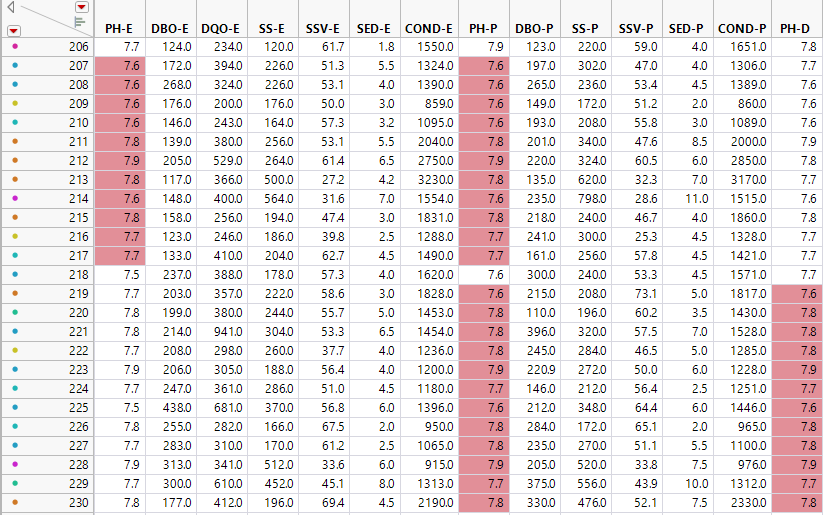
The Colorize feature colors the cells in the original data table that correspond to the duplicate sets in the report.