Analyze Distributions
The Distribution platform illustrates the distribution of a single variable (univariate analysis) using histograms, additional graphs, and reports. The word univariate simply means involving one variable instead of two (bivariate) or many (multivariate). However, you can examine the distribution of several individual variables within a single report. The report content for each variable changes depending on whether the variable is categorical (nominal or ordinal) or continuous.
• For categorical variables, the initial graph is a histogram. The histogram shows a bar for each level of the ordinal or nominal variable. The reports show counts and proportions.
• For continuous variables, the initial graphs show a histogram and an outlier box plot. The histogram shows a bar for grouped values of the continuous variable. The reports show selected quantiles and summary statistics.
Once you know how your data are distributed, you can plan the appropriate type of analysis going forward.
Note: For more information about the Distribution platform, see Distributions in Basic Analysis.
Scenario
You want to view the nutritional values of cereals so that you can eat a more healthful diet. Analyzing distributions of cereal data reveals answers to the following questions:
• Which cereals are highest in fiber?
• What is the average, minimum, and maximum number of calories?
• What is the median amount of fat?
• Which cereal contains the most fat?
• Are there any outliers in the data?
Create the Distributions
1. Select Help > Sample Data Library and open Cereal.jmp.
2. Select Analyze > Distribution.
3. Press Ctrl and click Manufacturer, Calories, Fat, and Fiber.
4. Click Y, Columns and then click OK.
Figure 6.2 Distributions for Manufacturer, Calories, Fat, and Fiber
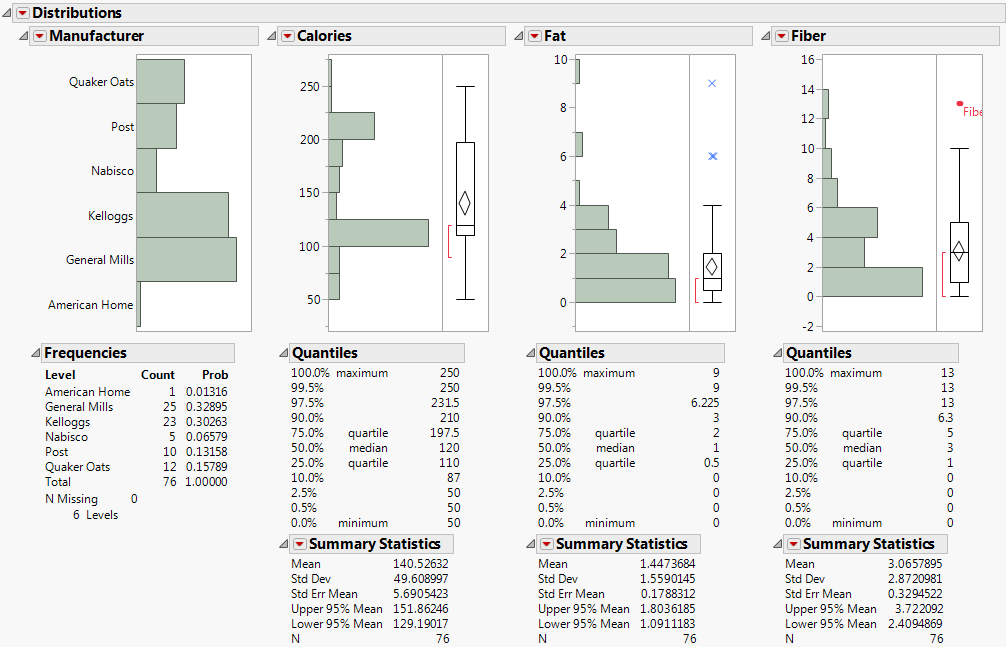
In the Fiber distributions, notice the following:
– Fiber One and All-Bran with Extra Fiber contain the most fiber as shown in the Fiber box plot. These cereals are outliers in terms of fiber content.
The row that contains Fiber One in Cereal.jmp is labeled. This label shows the name of the cereal next to a data point in graphs. To see the entire label, drag the right-most vertical border to the right. Place your cursor over the unlabeled data point to see “All Bran with Extra Fiber”.
In the Fat distributions, notice the following:
– Place your cursor over the top data point (the x marker) in the Fat box plot to see that 100% Nat. Bran Oats & Honey is the highest in fat.
– In the Fat Quantiles report, the median amount of fat is 1 gram.
In the Calories Quantiles report, notice the following:
– The maximum number of calories is 250.
– The minimum number of calories is 50.
5. In the Manufacturer histogram, click the bar for Nabisco.
Figure 6.3 Distributions for Nabisco Cereals
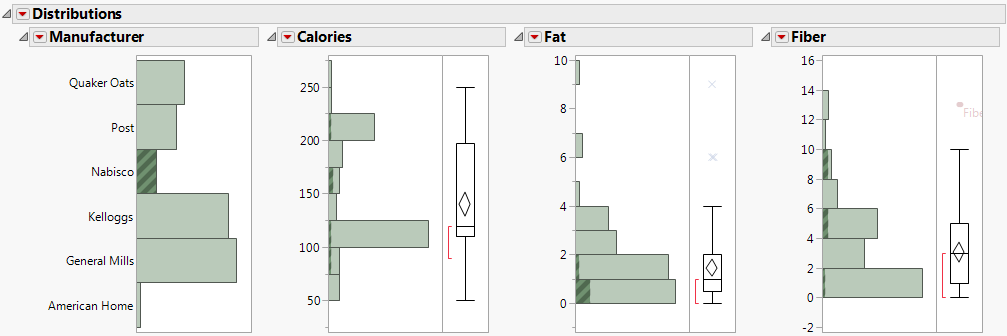
The Calories, Fat, and Fiber distributions for Nabisco cereals are highlighted in the other histograms. You can view the Calories, Fat, and Fiber distributions for the Nabisco cereals relative to the Calories, Fat, and Fiber distributions for the overall data. For example, the Fat distribution of Nabisco cereals seems to be lower than the Fat distribution for the overall data.
6. Click below the last Fiber bar to deselect all bars.
7. Press Shift and, in the Fiber histogram, click all histogram bars with a value above 8.
Figure 6.4 High-Fiber Cereals
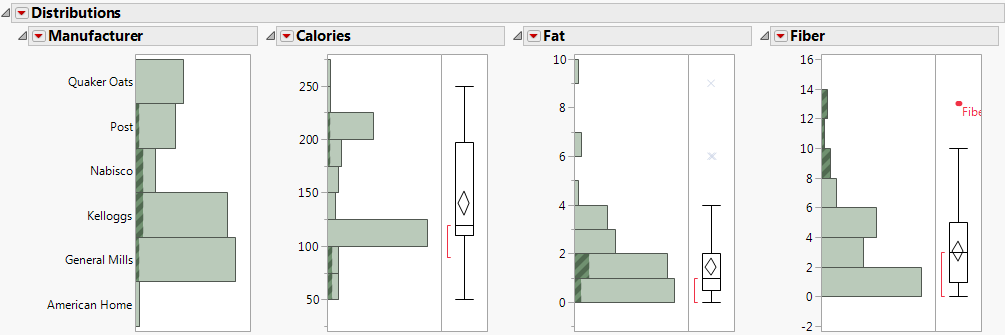
The highest-fiber cereals are highlighted in the Calories and Fat histograms. Because the histograms are linked, note that some of the high-fiber cereals are also low in fat.
8. Press Ctrl and Shift and deselect the two Calories histogram bars that are at or near 200.
High calorie cereals are eliminated from the histograms.
Figure 6.5 High-Fiber and Low-Calorie Cereals
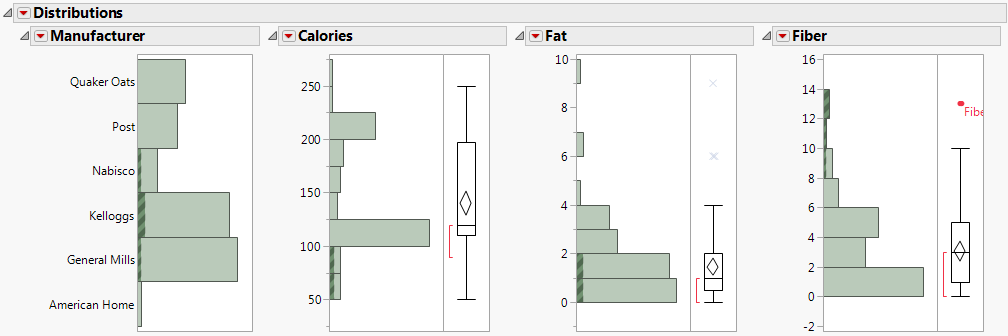
Tip: Leave the Distributions report open. You will use it later in a cluster analysis. See Analyze Similar Values.
Interpret the Results
Looking at the results, you can answer the following questions:
Which cereals are highest in fiber?
The Fiber box plot shows that All-Bran with Extra Fiber and Fiber One have the highest amount of fiber. These two cereals are outliers.
What is the average, minimum, and maximum number of calories?
The Calories histogram shows that the number of calories ranges from 50 to 275. The Calories Quantiles show that the number of calories ranges from 50 to 250, and the median number of calories is 120. The distribution is not uniform.
What is the median amount of fat?
The Fat Quantiles report shows that the median amount of fat is 1 gram.
Which cereal contains the most fat?
The Fat box plot shows that 100% Nat. Bran Oats & Honey is the highest in fat. This cereal is an outlier.
Draw Conclusions
To increase the amount of fiber in your diet, you decide to try All-Bran with Extra Fiber and Fiber One. These cereals are lower in calories and fat. Most cereals do not greatly increase the amount of fat in your diet, but you plan to avoid the high fat 100% Nat. Bran Oats & Honey. And although most cereals are relatively low in fat, they are not necessarily low in calories.