 Analyze the Experimental Data
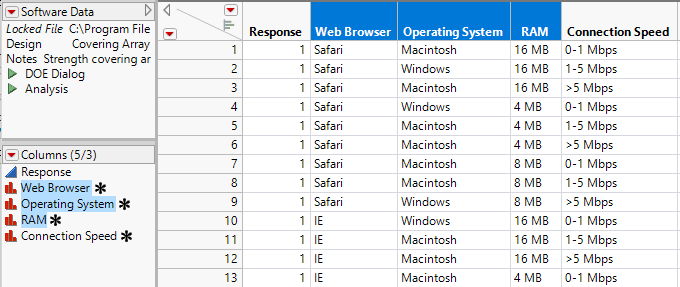
Now that you have your design table, you can conduct your experiment and record your data in the Response column of the design table (Figure 20.6). Your experimental results are in the Software Data.jmp sample data table.
1. Select Help > Sample Data Library and open Design Experiment/Software Data.jmp.
2. In the Table panel, click the green triangle next to the Analysis script.
Figure 20.7 Analysis of Software Experimental Data
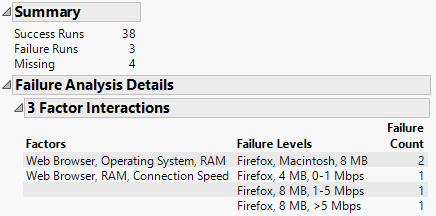
The Summary outline indicates that three tests failed and four tests did not result in a pass or fail outcome.
The Failure Analysis Details outline gives a breakdown of failures in terms of the associated three-way interactions. The outline lists only combinations of factor levels where all tests resulted in failure. If any test that involves a given three-way combination of settings results in success, then that three-way combination of settings cannot be responsible for system failure.
Two failures were associated with Web Browser set to Firefox, Operating System set to macOS, and RAM set to 8 MB. Notice that this combination led to failure regardless of the setting of Connection Speed.
3. Select the first line in the 3 Factor Interactions report.
Figure 20.8 Selection of an Interaction in the Analysis Report
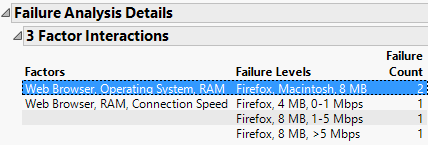
This action selects the corresponding rows and columns in the data table.
Figure 20.9 Corresponding Selection of Rows and Columns in the Data Table
Three failures were associated with combinations of Web Browser, RAM, and Connection Speed. Note that two of these failures, Firefox, 8 MB, 1-5 Mbps and Firefox, 8 MB, >5 Mbps, are among the two failures for the Web Browser, Operating System, and RAM interaction. Selecting any of these rows in the report selects the corresponding rows and columns in the data table.