Create Separate Axes in the X and Y Zones
To quickly plot multiple variables against separate axes in the X zone:
1. Select the columns in the Variables list.
2. Click Shift and then click the X zone.
If you want more control over where the variables appear, drag them individually. Drag additional variables above, below, or between existing variables in the X zone.
Figure 3.12 Dragging a Variable to the Right of the Existing Variable
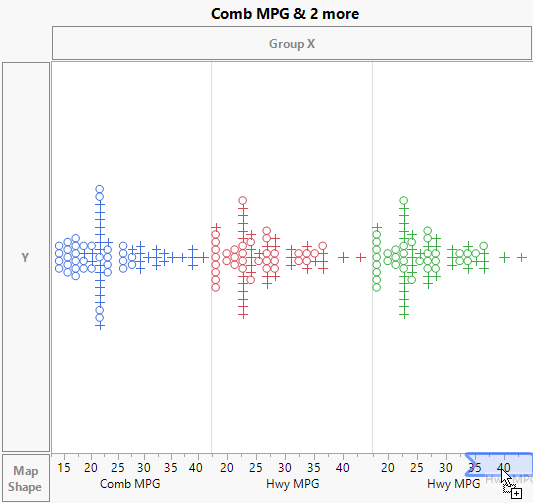
A single polygonal shape indicates when your variable is in the appropriate target zone.
To quickly plot multiple variables against separate axes in the Y zone:
1. Select the columns in the Variables list.
2. Click Shift and then click the Y zone.
If you want more control over where the variables appear, drag them individually. Drag additional variables above, below, or between existing variables in the Y zone.
Figure 3.13 Dragging a Variable above the Existing Variable
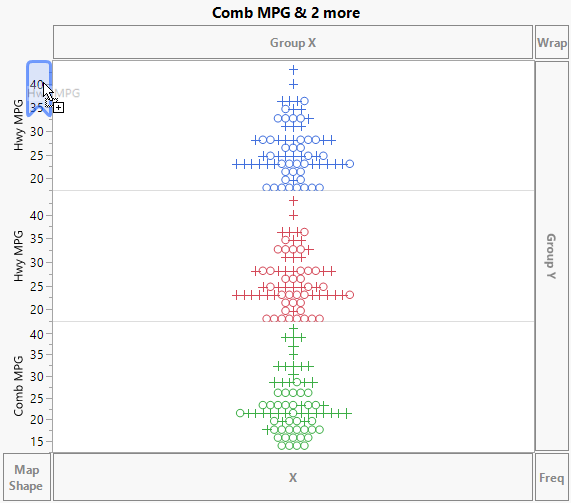
A single polygonal shape indicates when your variable is in the appropriate target zone.