Decision Matrix Report
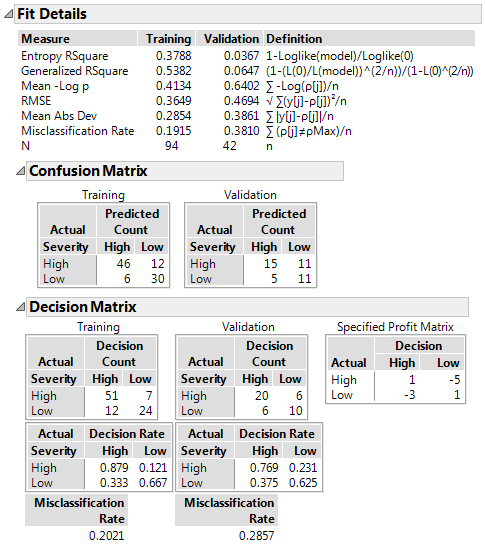
Figure 4.14 Fit Details Report with Decision Matrix Report
Note: This report is available only if the response has a Profit Matrix column property or if you specify costs using the Specify Profit Matrix option. The report is part of the Fit Details report.
When a profit matrix is defined, the partition algorithm uses the values in the matrix to calculate the profit for each decision. When you select Show Fit Details, a Decision Matrix report appears.
In the Decision Matrix report, the decision counts reflect the most profitable prediction decisions based on the weighting in the profit matrix. The report gives Decision Count and Decision Rate matrices for the training set and for validation and test sets (if defined). For reference, the profit matrix is also shown.
Note: If you change the weights in your Profit Matrix using the Specify Profit Matrix option, the Decision Matrix report automatically updates to reflect your changes.
Decision Count Matrix
Shows a two-way classification with actual responses in rows and classification counts in columns.
Specified Profit Matrix
Gives the weights that define the Profit Matrix.
Decision Rate Matrix
Shows rate values corresponding to the proportion of a given row’s observations that are classified into each category. If all observations are correctly classified, the rates on the diagonal are all equal to one.
Tip: You can obtain a decision rate matrices for a response using the default profit matrix with costs of 1 and -1. Select Specify Profit Matrix from the red triangle menu, make no changes to the default values, and click OK.
The matrices are arranged in two rows:
• The Decision Count matrices are in the first row.
• The Specified Profit Matrix is to the right in the first row.
• The Decision Rate matrices are in the second row.