Designs of Different Run Sizes
In this example, compare three designs with run sizes 16, 20, and 24. The designs are constructed for main effect models. Use the Compare Designs platform to determine whether the potential benefits of using a larger run size are worth the additional cost in resources.
1. Select Help > Sample Data, click Open the Sample Scripts Directory, and select Compare Three Run Sizes.jsl.
2. Right-click in the script window and select Run Script.
Three design tables are constructed using Custom Design, with only main effects as entries in the Model outline:
– 16-Run Design
– 20-Run Design
– 24-Run Design
You want to compare these three designs. Notice that the 16-Run Design table is active.
3. In the 16-Run Design table, select DOE > Design Diagnostics > Compare Designs.
4. From the Compare ‘16-Run Design’ with list, select 20-Run Design and 24-Run Design.
Panels for each of these designs are added to the launch window. JMP automatically matches the columns in the order in which they appear in the three design tables.
5. Click OK.
Figure 16.8 Power Analysis Comparison
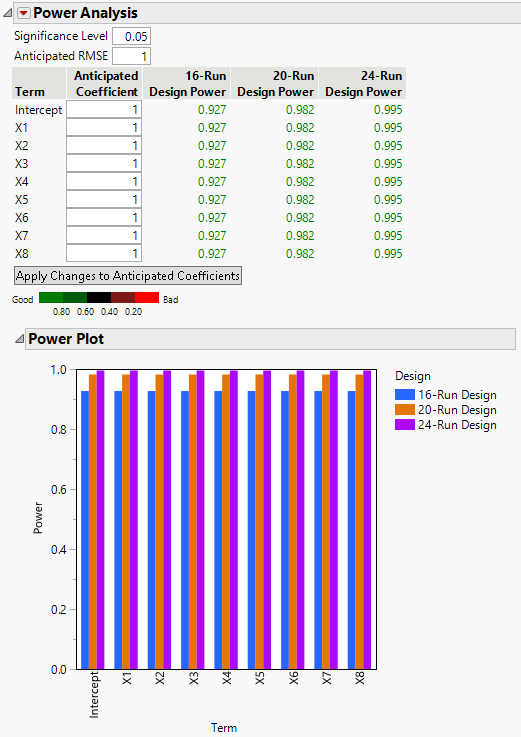
All three designs have high power for detecting main effects if the coefficients are on the order of the Anticipated RMSE.
Figure 16.9 Fraction of Design Space Comparison
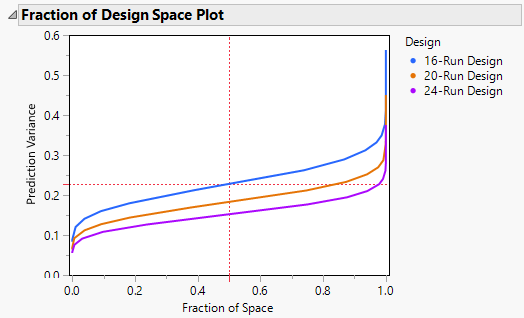
As expected, the 24-run design is superior to the other two designs in terms of prediction variance over the entire design space. The 20-run design is superior to the 16-run design.
6. In the Absolute Correlations report, open the Color Map on Correlations report and the three color map reports under it.
Figure 16.10 Color Map on Correlations Comparison
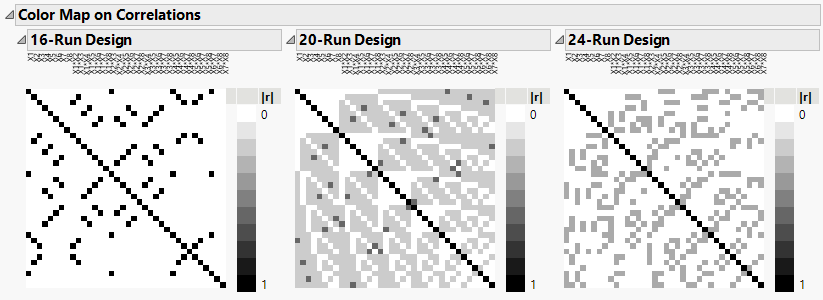
For the 16-run design, the Color Map on Correlations indicates that there is confounding of some main effects with some two-factor interactions, and confounding of two-factor interactions.
For the 20-run design, the Color Map on Correlations indicates that there are some large correlations between some main effects and some two-factor interactions, and between some two-factor interactions.
The 24-run design shows only moderate correlations between main effects and two-factor interactions, and between two-factor interactions.
Figure 16.11 Absolute Correlations Comparison
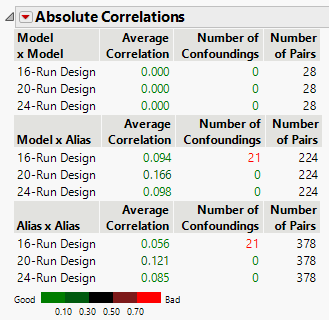
The Absolute Correlations table summarizes the information shown in the Color Maps on Correlations. Recall that the model for all three designs consists of only main effects and the Alias Matrix contains two-factor interactions.
For the 16-run design, the Model x Alias portion of the table indicates that there are nine confoundings of main effects with two-factor interactions. The Alias x Alias portion indicates that six two-factor interactions are confounded.
Figure 16.12 Design Diagnostics Comparison
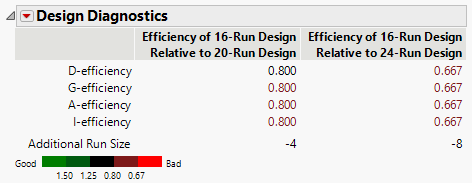
The Design Diagnostics report compares the efficiency of the 16-run design to both the 20-run and 24-run designs in terms of several efficiency measures. Relative efficiency values that exceed 1 indicate that the reference design is preferable for the given measure. Values less than 1 indicate that the design being compared to the reference design is preferable. The 16-run design has lower efficiency than the other two designs across all metrics, indicating that the larger designs are preferable.
7. In the Factors outline, select X1 through X3.
8. In the Model outline, select Interactions > 2nd.
An Inestimable Terms window appears, telling you that the 16-run design cannot fit one of the effects that you just added to the model (X1*X2).
9. Click OK.
The other two effects, X1*X3 and X2*X3, are added to the Compare Design report. You can examine the report to compare the designs if the two interactions are active.