Example of a Grouped Nonparametric Density Contour
This example shows how to group data points and format each nonparametric density contour.
1. Select Help > Sample Data Library and open Iris.jmp.
2. Select Graph > Scatterplot 3D.
3. Select Sepal length, Sepal width, Petal length, and Petal width and click Y, Columns.
4. Click OK.
5. Click the Scatterplot 3D red triangle and select Nonpar Density Contour.
6. Select Grouped by Column.
7. Select Species and click OK. A different colored contour is displayed for each of the three species.
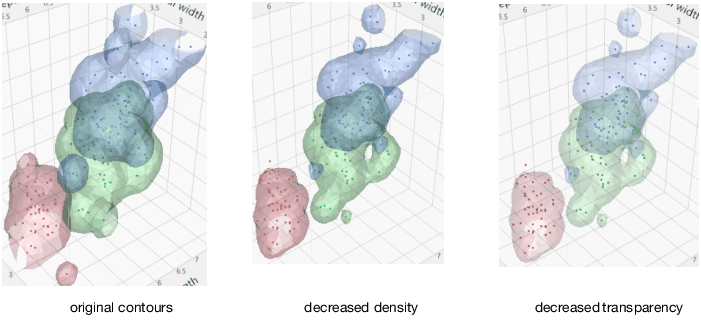
8. Type 0.25 in the first Contour Quantile box. 25% of the data points appear outside the contour surfaces, which results in smaller contours.
9. Type 0.15 in the first Transparency box. The contours are 15% opaque.
Figure 9.10 Changing the Nonparametric Density Contour Transparency and Density
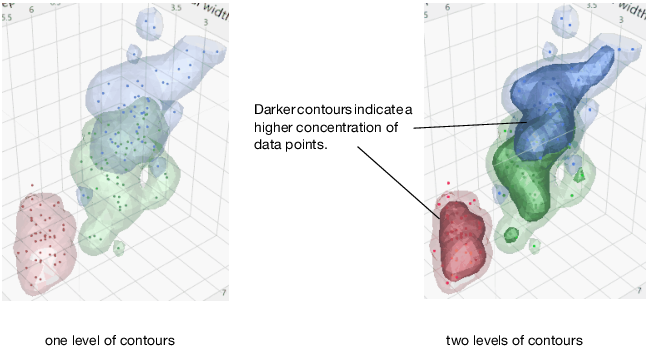
10. Select the second check box. The contour quantiles are the same (.25), so the new contours overlap the first ones.
11. Type 0.5 in the second Contour Quantile box. 50% of the data points appear outside the contour surfaces. A second set of contours appears within the first, to further illustrate the density of the data points.
Figure 9.11 Adding a Second Nonparametric Density Contour
You can now format the second levels of contours and turn on the third level of contours.
The options for formatting the grouped and ungrouped nonparametric density contours are similar. The only difference is that you cannot change the color of each grouped nonparametric density contour. See Scatterplot 3D Platform Options for options.