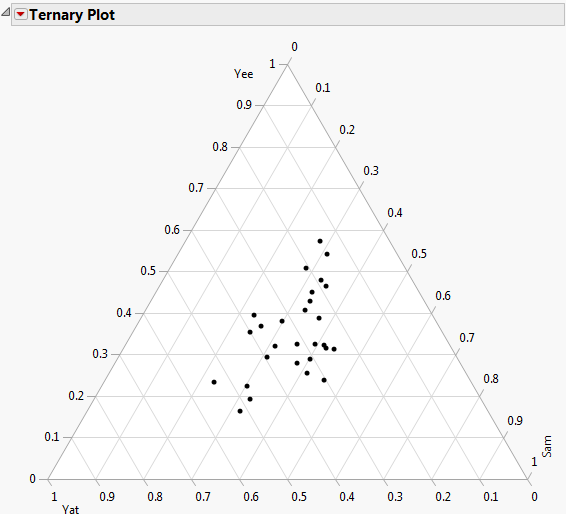
Example of a Ternary Plot
This example uses the Pogo Jumps.jmp sample data table. The data, adapted from Aitchison (1986), show measurements for pogo jumps of seven finalists in the 1985 Hong Kong Pogo-Jump Championship. A single pogo jump is the total jump distance in three consecutive bounces, referred to as yat, yee, and sam.
1. Select Help > Sample Data Library and open Pogo Jumps.jmp.
2. From the Graph menu, select Ternary Plot.
3. Select Yat, Yee, and Sam and click X, Plotting.
4. Click OK.
Figure 11.2 Example of a Ternary Plot
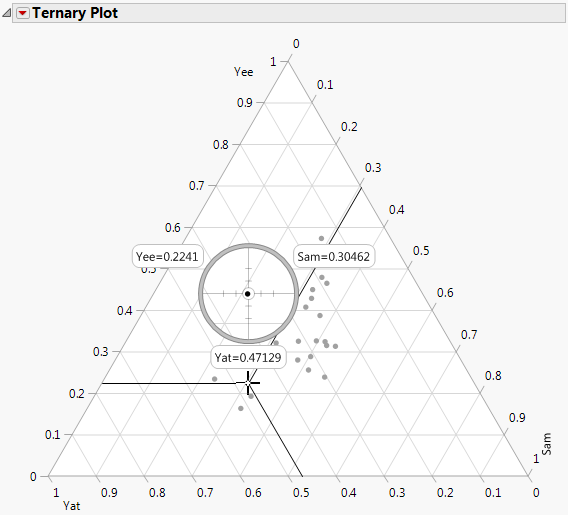
Use the crosshairs tool to determine exact coordinates of points within the plot.
Figure 11.3 Using the Crosshairs Tool
To get a better idea of how the three bounces contribute to total distance, assign each contestant’s points a different color and marker.
1. Right-click the plot and select Row Legend.
2. Select Finalist in the column list box.
Colors should be automatically set to JMP Default.
3. Select Standard from the Markers menu.
4. Click OK.
Figure 11.4 Pogo Data Colored by Finalist
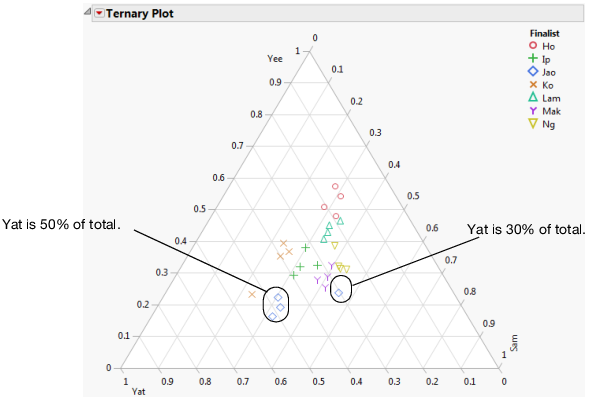
Note that most of the finalists are consistent in the composition of total distance. However, two finalists, Jao and Ko, both have one jump that is not consistent with their other jumps. For example, for three of Jao’s jumps, the Yat composed about 50% of the total distance, but for the other jump, the Yat composed only 30% of the total distance. That jump is not consistent with the others. A similar observation can be made about Ko’s jumps.