Example of an Area and Line Chart
|
Data |
This example uses data based on website traffic. It includes hourly measurements and historical range information. |
|
Techniques |
This example uses Recode to improve data labels, multiple graph elements (area and line), and legend customization. It also shows how to remove variables from a graphing element when multiple variables are plotted on a single axis. |
|
Goal |
The goal of this example is to display trend lines for website traffic within an overall range. |
1. Select Help > Sample Data Library and open Bands.jmp.
2. Select the Hour column, and then select Cols > Recode.
3. In the Recode window, make these changes:
a. Click the red triangle and select First Word.
Notice that the New Values include only the first hour.
b. Under New Values, click 12am and enter midnight. Click 12pm and enter noon.
Figure 4.6 Completed Recode Window
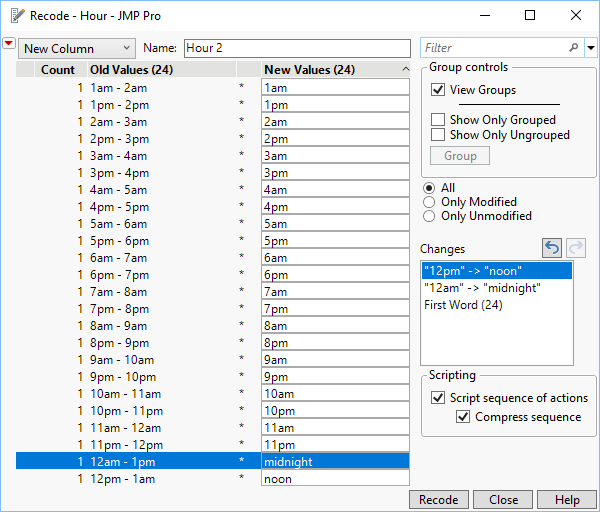
c. Click Recode.
A new column called Hour 2 is added to the data table.
Tip: Recode enables you to recode your data to a new column, as a formula in a new column, or to overwrite your current data. For more information about Recode, see Recode Data the in the Using JMP book.
4. Select Graph > Graph Builder.
5. Select Hour 2 and drag it to the X zone.
Note: The ordering of the X axis is logical, going from midnight to 11pm. This is because the Hour column has a value ordering column property that was copied to the Hour 2 column when you created it with Recode.
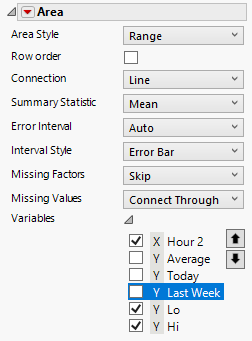
6. Select Average, Today, Last Week, Lo, and Hi and drag them to the Y zone.
7. Click the Area element ![]() .
.
8. In the Area properties panel, make these selections:
a. Change the Area Style to Range.
b. Open Variables and deselect Average, Today, and Last Week.
Now the area element is applied only to the Lo and Hi variables.
Figure 4.7 Completed Area Properties Panel
9. Hold down the Shift key and click the Line element ![]() .
.
Tip: Holding down the Shift key and clicking adds additional elements to the graph, without replacing any existing elements.
10. In the Line properties panel, open Variables and deselect Lo and Hi.
Now the line element is applied only to the Avg, Today, and Last Week Y variables.
Figure 4.8 Completed Line Properties Panel
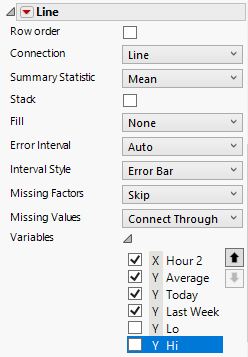
Figure 4.9 Area and Line Graphs
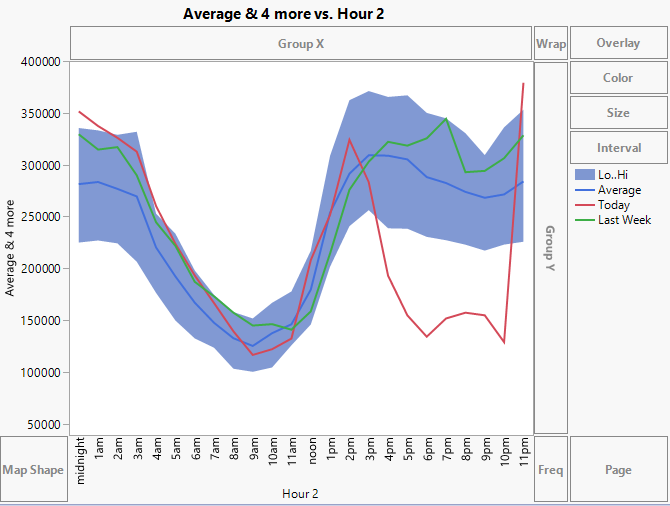
11. Customize the graph elements using the legend:
a. In the legend at right, double-click Lo..Hi.
b. In the Legend Settings window, double-click Lo..Hi and rename it to Typical.
c. Highlight Today and Last Week, and click the up arrow to move them up one, so that the order is: Typical, Today, Last Week, and Average. Click OK.
d. Right-click Typical > Fill Color and select light gray.
12. Right-click the X axis > Axis Settings. For Label Orientation, click Horizontal, and then click OK.
13. Change the titles of the axes and graph as follows:
a. Click the Y-axis title and enter Volume of web traffic.
b. Click the X-axis title and enter Time of day.
c. Click the graph title and enter Current and Historical Website Traffic Based on Time of Day.
14. Click Done.
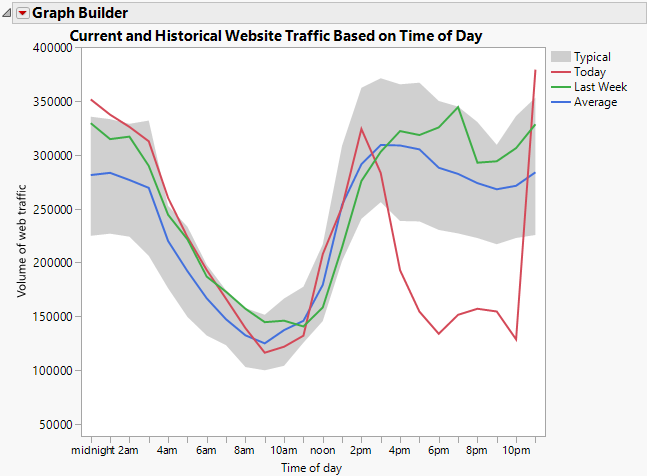
Figure 4.10 Completed Area and Line Graph
Tip: If an item in the legend is still highlighted, click it to deselect it.
The graph shows that the afternoon website traffic fell to unusually low levels today. The red trend line that represents today’s traffic peaks at 1pm and then falls to outside of the gray band that represents the range of expected daily traffic for this website by about 3pm.