Example of an MDMVCC with Historical Data
This example demonstrates the use of historical data to set the monitoring limits for current data.
1. Select Help > Sample Data Library and open Quality Control/Flight Delays.jmp.
2. Select Analyze > Quality and Process > Model Driven Multivariate Control Chart.
3. Select the AA through WN and click Process.
4. Select Flight Date and click Time ID.
5. Enter 16 for Historical Data End at Row.
6. Click OK.
Figure 11.9 T2 Chart for Historical and Current Data
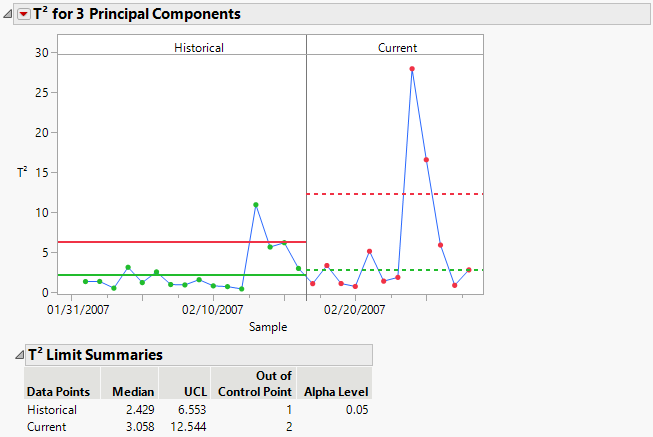
Note that there are two sets of limits. One set applies to the historical data. A second set of limits applies to the current data. For more information about how the historical data is used to calculate the two sets of limits, see Limits.
Tip: Turn on Automatic Recalc to enable the chart to automatically update as you add additional observations to the data table. The Automatic Recalc option is under redo when you click the PCA Model Driven Multivariate Control Chart red triangle.