Example of Creating a Journal
1. Select Help > Sample Data Library and open Companies.jmp.
2. Select Analyze > Distribution.
3. Select both Type and Size Co and click Y, Columns.
4. Click OK.
5. Click the Type red triangle and select Histogram Options > Show Counts.
6. Click the Size Co red triangle and select Mosaic Plot.
7. Select Edit > Journal to journal these results. The results are duplicated in a journal window.
Figure 7.2 Journal of Distribution Results
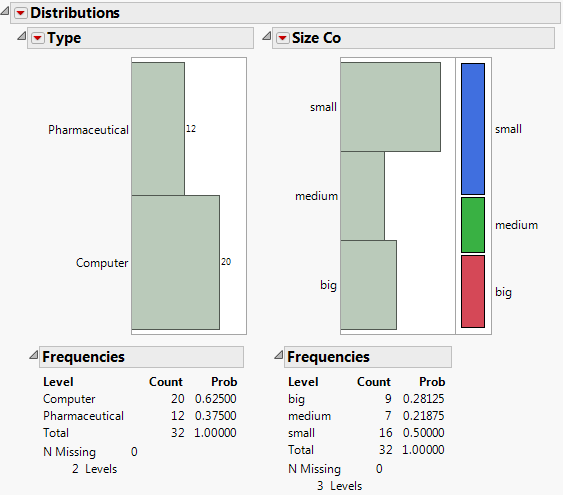
The results in the journal are not connected to the data table. In the Type bar chart, if you click the Computer bar, no rows are selected in the data table.
Since the journal is a copy of your results, most of the red triangle menus do not exist. A journal does have a red triangle menu for each new report that you add to the journal. This menu has two options:
Rerun in new window
If you have the original data table that was used to create the original report, this option runs the analysis again. The result is a new report window.
Edit Script
This option opens a script window that contains a JSL script to re-create the analysis. JSL is a more advanced topic that is covered in the Scripting Guide and JSL Syntax Reference.