Example of Functional DOE
This example uses the Formulation For Homogeneity DOE.jmp data table to explore how combinations of ingredients effect the homogeneity grade of a compound across different temperatures. The three ingredients that form the compound are the primary ingredient (labeled Active), Water, and a Solvent. There are 32 combinations of ingredients; these combinations are denoted by the values in the Formulation column. For each formulation, the Homogeneity Grade is measured from 20 to 70 degrees Celsius at 5 degree intervals. By plotting these measurements across the different temperatures, you can form a curve for each formulation. Use the Functional Data Explorer platform to determine how the curves change depending on the values of Active, Water, and Solvent.
1. Select Help > Sample Data Library and open Functional Data/Formulation For Homogeneity DOE.jmp.
2. Select Analyze > Specialized Modeling > Functional Data Explorer.
3. In the Stacked Data Format tab, select Homogeneity Grade and click Y, Output.
4. Select T and click X, Input.
5. Select Formulation and click ID, Function.
6. Select Solvent, Active, and Water and click Z, Supplementary.
These variables are not used in the initial functional data analysis. However, by specifying them here as supplementary variables, you can use them later when fitting models.
7. Click OK.
8. Click the Functional Data Explorer red triangle and select Models > B-Splines.
The best fitting model is a linear spline model with one knot.
Figure 15.10 Functional PCA for Homogeneity Grade
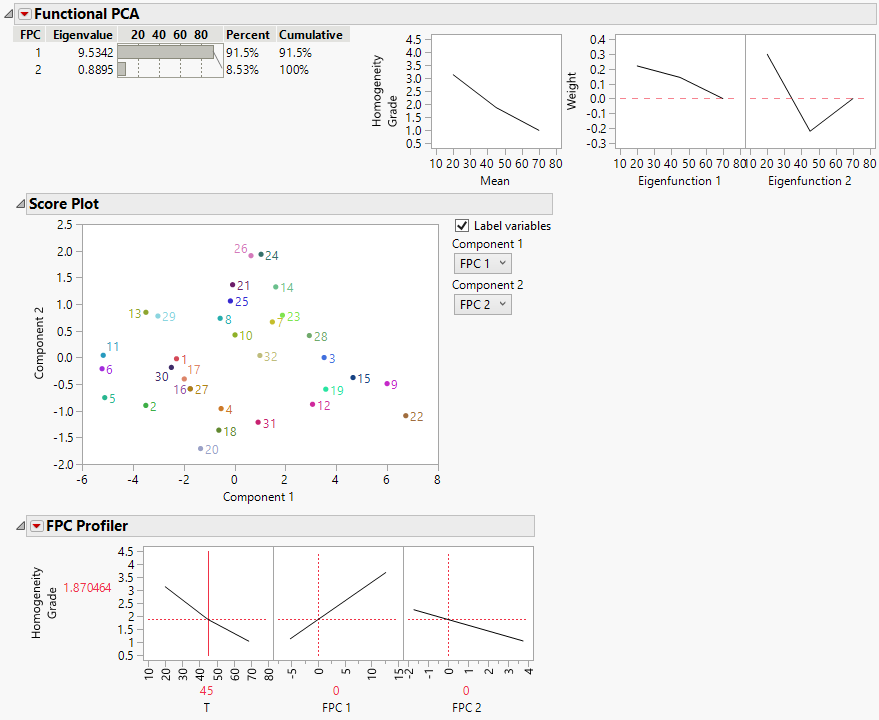
The Functional PCA report shows that two functional principal components are needed to explain the variability in the data. The FPC Profiler shows how Homogeneity Grade is affected by the FPCs across the different temperatures. However, there is no way to tell how the actual ingredients affect the Homogeneity Grade.
9. Click the red triangle next to B-Spline on Initial data and select Functional DOE Analysis.
The Functional DOE Analysis option fits a generalized regression model to each principal component score using the three supplementary variables as predictors. Because the data table contains a Model script, the models that are fit are based on the model defined in the script.
Note: If your data table does not contain a Model script, a two degree factorial model is fit.
Figure 15.11 FDOE Profiler for Homogeneity Grade
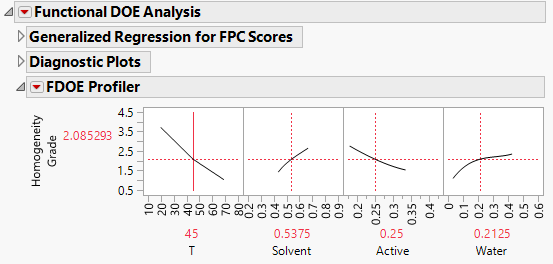
The FDOE Profiler enables you to explore how Homogeneity Grade changes based on the predictors you are actually interested in. In general, Homogeneity Grade seems to decrease as the amount of Active increases.
Note: In this example, the values of Active, Solvent, and Water are constrained to sum to 1. This affects the normal behavior of the profiler.