Example of Logistic Regression for Matched Case-Control Studies
This section provides an example using the Choice platform to perform logistic regression on the results of a study of endometrial cancer with 63 matched pairs. The data are from the Los Angeles Study of the Endometrial Cancer Data reported in Breslow and Day (1980). The goal of the case-control analysis was to determine the relative risk for gallbladder disease, controlling for the effect of hypertension. The Outcome of 1 indicates the presence of endometrial cancer, and 0 indicates the control. Gallbladder and Hypertension data indicators are also 0 or 1.
For more information about performing logistic regression using the Choice platform, see Logistic Regression.
1. Select Help > Sample Data Library and open Endometrial Cancer.jmp.
2. Select Analyze > Consumer Research > Choice.
3. Check that the Data Format selected is One-Table, Stacked.
4. Click the Select Data Table button.
5. Select Endometrial Cancer as the profile data table. Click OK.
6. Select Outcome and click Response Indicator.
7. Select Pair and click Grouping.
8. Select Gallbladder and Hypertension and click Add in the Construct Profile Effects window.
9. Deselect the Firth Bias-Adjusted Estimates check box.
10. Click Run Model.
11. Click the Choice Model: Outcome red triangle and select Utility Profiler.
Figure 4.42 Logistic Regression on Endometrial Cancer Data
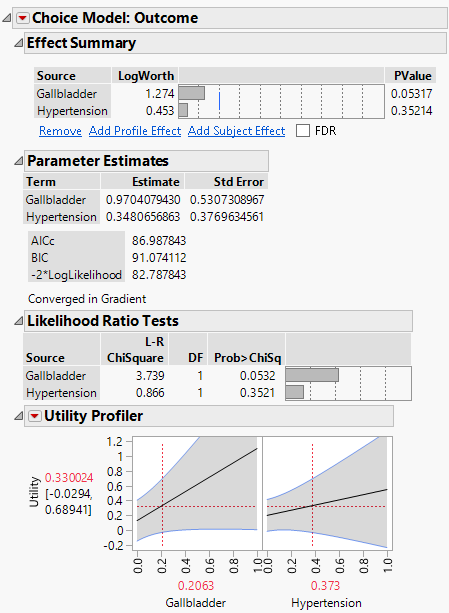
Likelihood Ratio tests are given for each factor. Note that Gallbladder is nearly significant at the 0.05 level (p-value = 0.0532). Use the Utility Profiler to visualize the impact of the factors on the response.