 Example of Support Vector Machines
You have baseline medical data for 442 diabetic patients. You also have a binary measure of diabetes disease progression obtained one year after each patient’s initial visit. This measure quantifies disease progression as either Low or High. You want to construct a classification model to predict the disease progression for future patients as High or Low. You explore both kernel function options.
1. Select Help > Sample Data Library and open Diabetes.jmp.
2. Select Analyze > Predictive Modeling > Support Vector Machines.
3. Select Y Binary and click Y, Response.
4. Select Age through Glucose and click X, Factor.
5. Select Validation and click Validation.
6. Click OK.
7. In the Model Launch control panel, check that the kernel function is a Radial Basis Function with Cost parameter 1 and Gamma parameter 0.1.
8. Click Go.
9. Click the gray triangle next to Model Launch to open the Model Launch control panel.
10. Change the kernel function to a Linear function with cost parameter 1.
11. Click Go.
Figure 9.2 Model Comparison Report
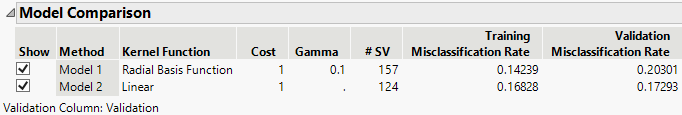
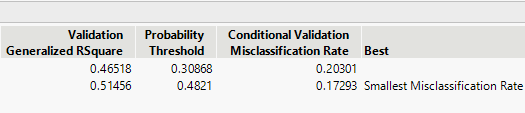
The Model Comparison report shows that the best model in terms of misclassification rate is the model with the linear kernel function with cost parameter 1. This is the model to further analyze.
12. Scroll to the Support Vector Machine Model 2 report.
Figure 9.3 Model Report for Best Fitting Model
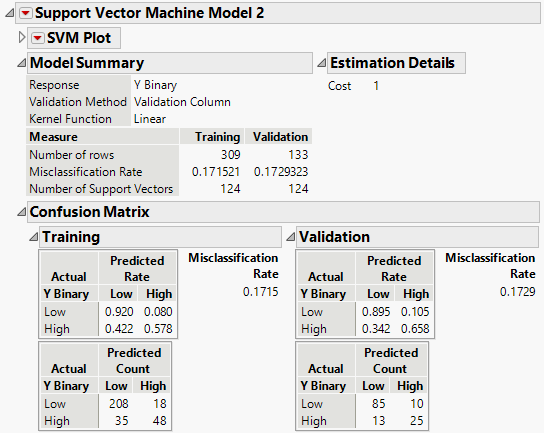
The Model Summary report shows that the misclassification rates for the training and validation sets are very similar. This is a good indication that the model did not overfit the data. The confusion matrices provide more information about the types of observations that are misclassified by the model. In the confusion matrices, the upper left corner shows that the model correctly categorizes the Low responses most of the time (92% in training and 89.5% in validation). However, fewer of the High responses are correctly categorized (57.8% in training and 65.8% in validation). Therefore, most of the misclassifications are the High responses being misclassified as Low.